I have been implementing some code changes to stay up-to-date with newest zig versions and I have noticed that execution of the exe binary of my chess engine compiled with newest versions is pretty slow.
For instance if I compile code with version 0.12.0-dev.1536+6b9f7e26c engine runs with 1800k nodes per second with .optimize = .ReleaseFast, and 310k nodes per second with .optimize = .Debug, while with version 0.12.0-dev.3657+d23a8e83d it runs with around 80k nodes per second with .optimize = .ReleaseFast. I know that there were some changes in build system, but as far as I know they were not related to type of optimization used in build. Has anybody any clues why newest version would build a slower version of exe file.
I’d suggest you to profile the application to figure out where exactly the problem comes.
Off the top of my head I know of one recent performance regression related to arrays in a struct Another array access performance issue. · Issue #13938 · ziglang/zig · GitHub, the fix of this issue was reverted in january.
So if you got lots of arrays inside of structs you can try applying the fix mentioned in the issue and check if that changes anything.
I tried the solution for issue with arrays, but it does not seem to be the problem in my case. I have a lot of arrays so I did not test on all of them, so I might have missed the problematic one.
I guess I need to learn how to do profiling on zig code. Any suggestion which profiler I should use, I would prefer windows.
There is nothing special about profiling zig code, you can use any C/C++ compatible profiler.
List of performance analysis tools - Wikipedia
I personally use AMD uprof, and so far it worked well with zig.
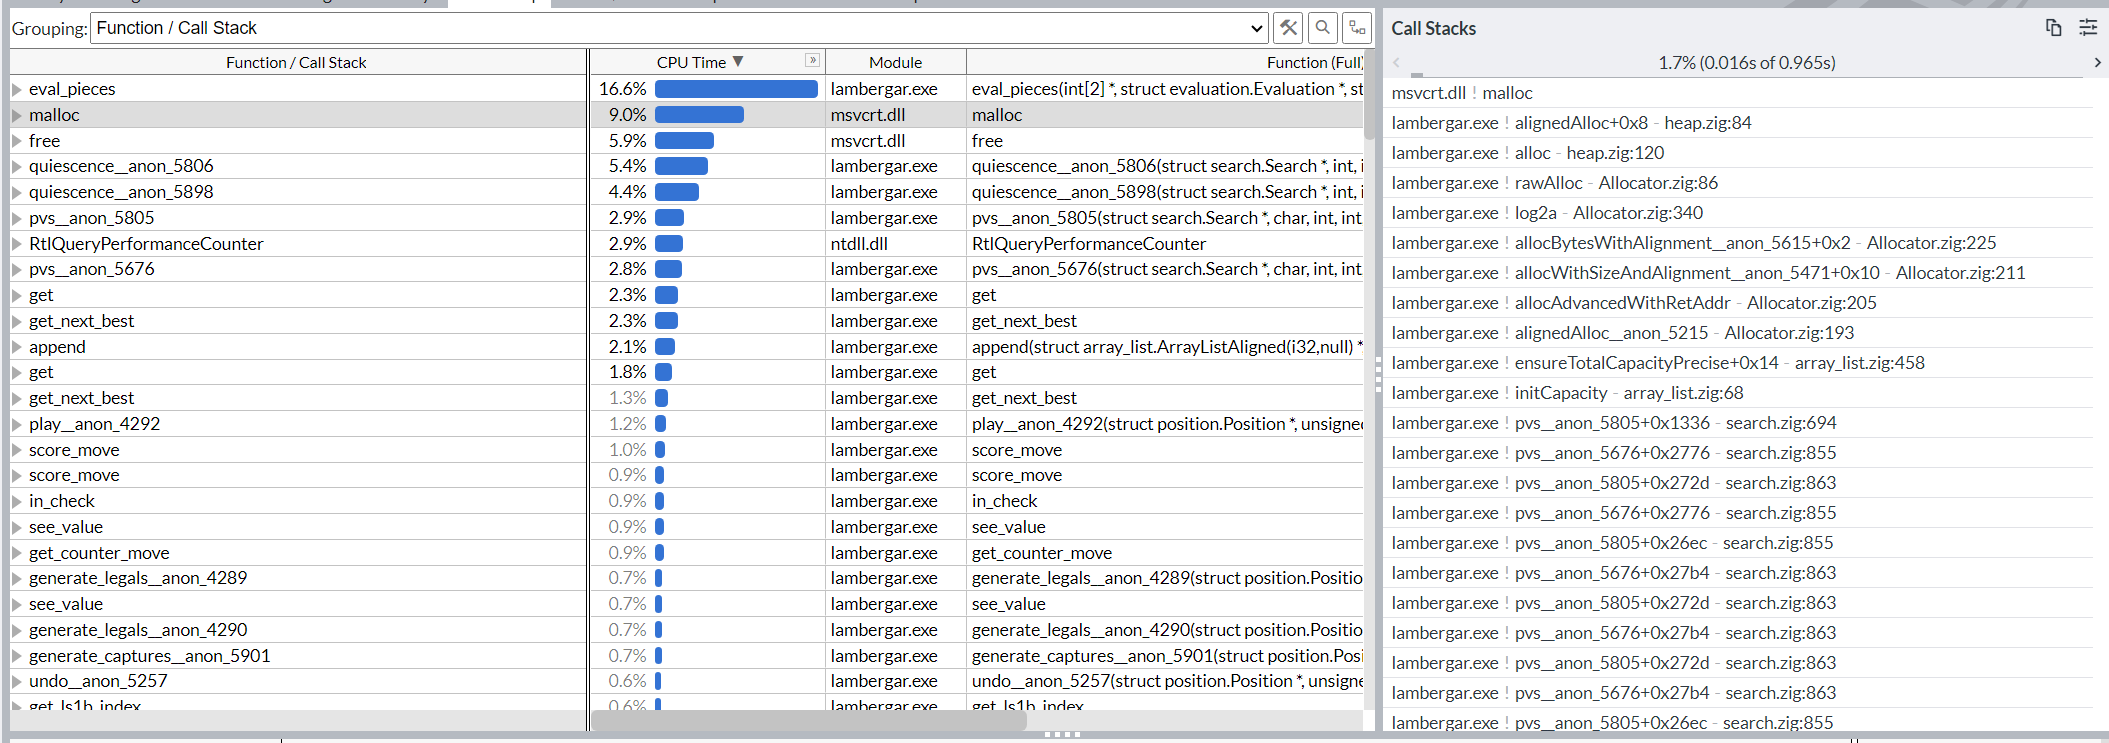
Try to find out what causes the most memcpy calls, by drilling down deeper in the call stack.
Then see whether those are places that could be improved, for example if you have data structures that aren’t initialized with a capacity even though you could provide one, or maybe even estimate / measure one. (If the memcpy calls are caused by repeated re-allocation and resizing)
Think about whether the parts that cause most cpu time, can be reduced by algorithmic improvements, using more domain knowledge, pre-computing things, caching things. And then iterate and see whether it improved things.
Judging by the fact that that malloc is not present any more, it seems that the main difference was going from using the libc allocator to a statically linked one, which is probably what’s doing memcpy a bunch.
I noticed a couple weeks ago that memcpy was going through the PLT in some code i was trying to help with, so that means it was dynamically linked and has to go through indirection. Is that an LLVM thing - doesn’t it have a builtin memcpy? gcc can use its builtin mempcy and then inline it, but zig/llvm/something is pushing the call to something dynamic. What’'s inserting the @PLT calls especially for something as important as memcpy?
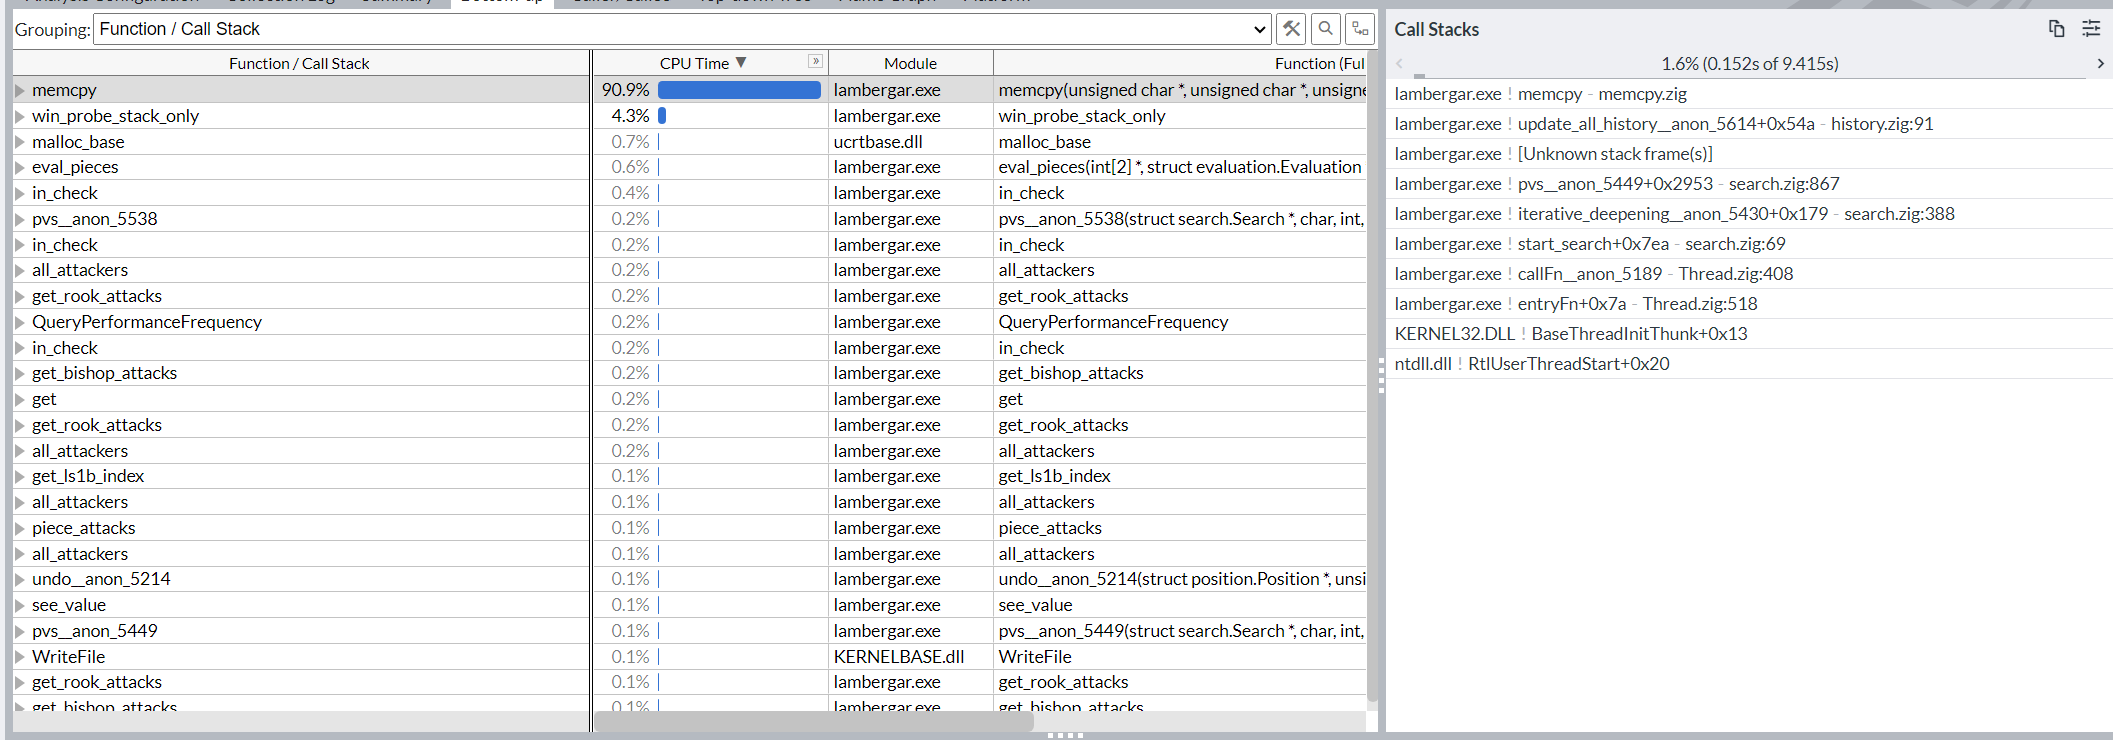
From the displayed call stack, the 1.6% of the calls are:
(update_all_history) history.zig:91 → memcpy.zig
examine history.zig at line 91, normally inside the function update_all_history.
Also view the other call stacks for useful stack traces.
Its an easy instrumenting option to use (just pass -pg and the compiler chain handles all the rest).
CPU tracing is really inexact and the sampling of EIP is only done at about 4000 Hz and can miss a lot of small important code paths that might not be taken as much. eg, a network stack where you spend a lot of ttime waiting on data even when streaming and when you do get a packet the decode is in microseconds it is hard for a sampling profiler to get good results.
I miss Purify (if anybody else remembers that). I’ve tried tracy, but it seems like it is only realtime and you need to have the gui running but most of all, I just can’t get it to work with zig – all the tutorials are a little dated esp concerning the recent build system changes.
right now i have a couple functions that use rdtsc and @src to a buffer then log it before i exit the program.
I am using c_allocator and I am linking libc library in build.zig. It is the same in both cases. Documentation for linking libc for 0.11.0 and 0.12.0 seem to be the same, seo there is no documented change.
I initialize them to 0 in init function, before I do search. But the problem were actually the lines where I read from the table and store in new variable, like this
const sc_hist: i32 = self.sc_history[me.toU4()][move.from][move.to];
or this
cm_hist = self.sc_counter_table[p_piece.toU4][parent.to][piece.toU4()][move.to];
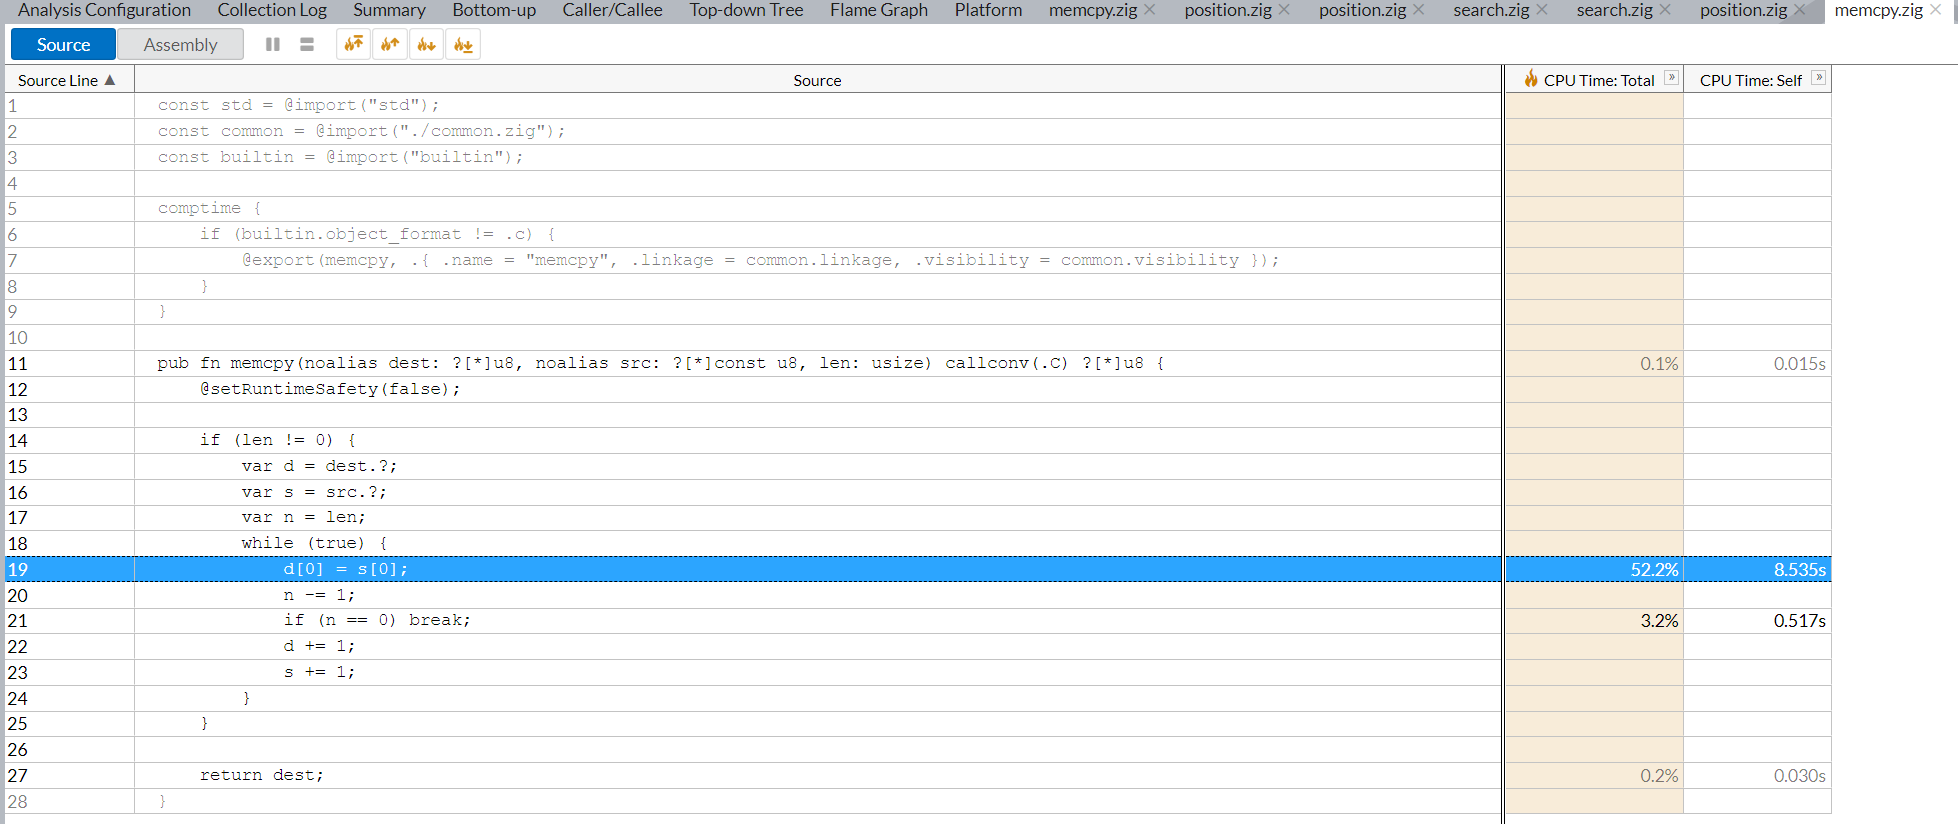
It seem that 52% of CPU time is spent in memcpy.zig in line 19
If you have loops; the read order is important for cache.
For example in v[x][y] the execution time between for x after for y and for y after for x can be orders of magnitude slower/faster.
I think we would have to see the source code and the generated assembly for update_all_history. Such a huge difference with the same code could indicate that your code has undefined behavior, or a bug with the compiler.