That looks exactly like it would trigger the issue I linked. It should be fixed by just doing
const sc_hist: i32 = (&self.sc_history)[me.toU4()][move.from][move.to];
cm_hist = (&self.sc_counter_table)[p_piece.toU4][parent.to][piece.toU4()][move.to];
That looks exactly like it would trigger the issue I linked. It should be fixed by just doing
const sc_hist: i32 = (&self.sc_history)[me.toU4()][move.from][move.to];
cm_hist = (&self.sc_counter_table)[p_piece.toU4][parent.to][piece.toU4()][move.to];
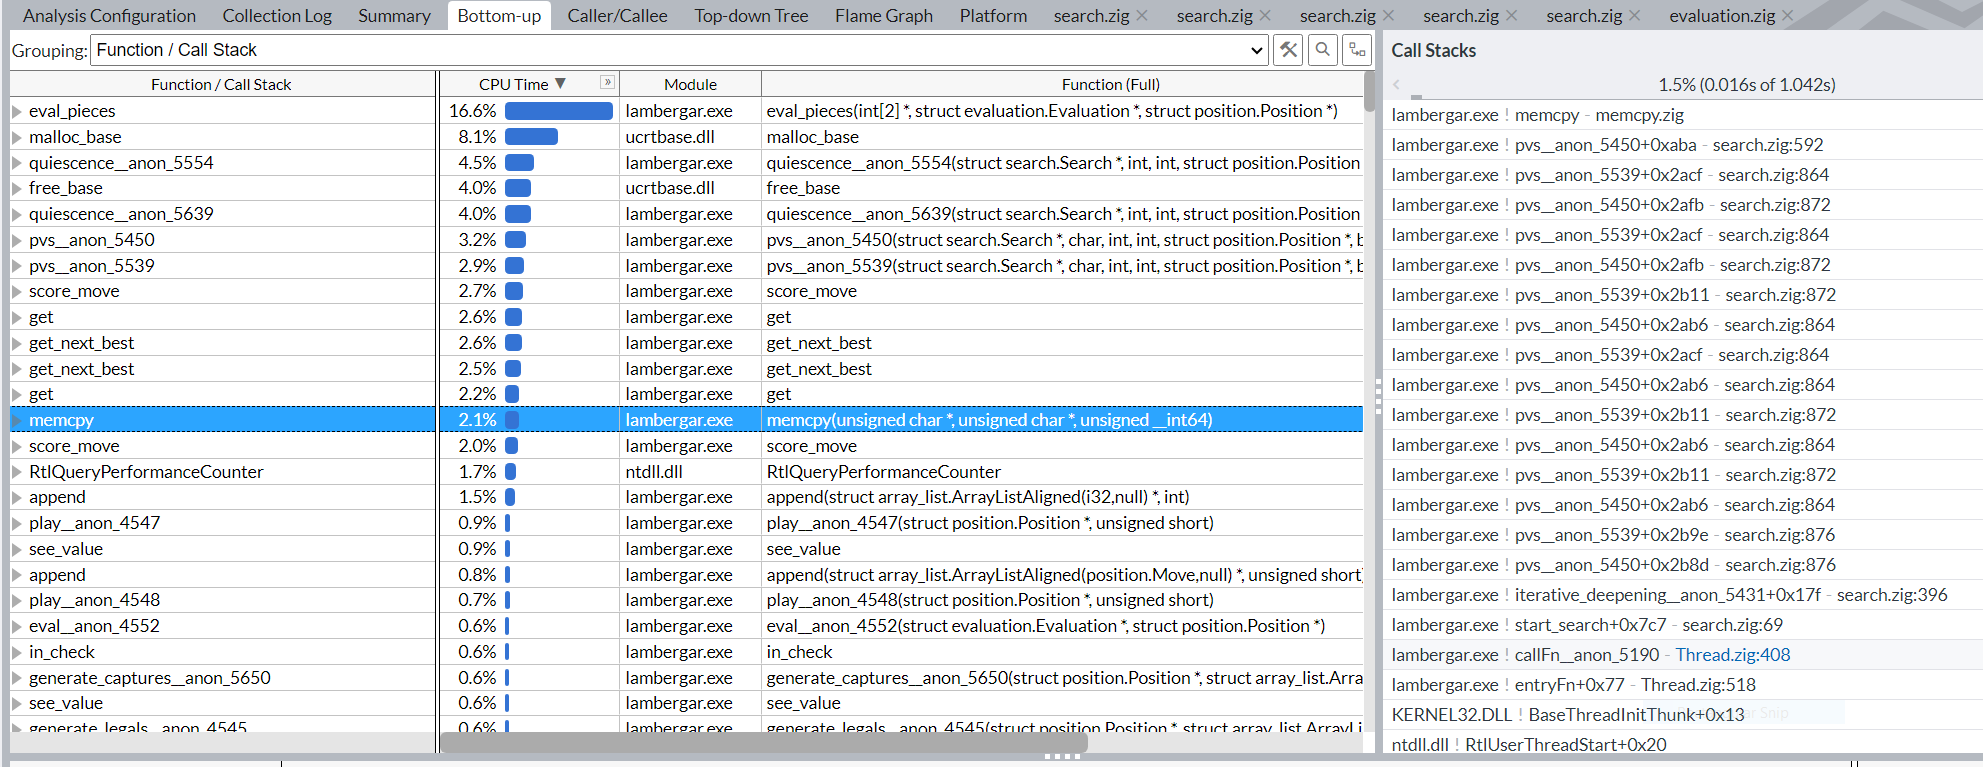
I don’t see undefined behavior in the code, nor anything crazy that should trigger a bunch of memcpys.
To get the assembly, you want to use getEmittedAsm.
I did not increase speed, but it helped with stability. Now the program does not crash, but it is still slow.
Makes sense, according to your profile results one of the lines only took 1.6% of your total runtime. I guess you’d need to also apply the same fix in all the other hotspots around your code in order to actually see a difference in speed.
I just saw the size of your arrays and I’m pretty sure you are getting what is called skid and skew. When a sample is taken by the CPU jit needs to blame the time on an operation, but since modern CPUs have 100s of inflight ops it isn’t easy so Intel just pics the oldest op in the reorder buffer and blames it on that. In this cse it is waiting on a memory fetch and that mov is prob waiting on a cache miss before it can retire, so it gets blamed. (to some extent it is its fault though — it is really funny when you see a NOP take 10% of your time because it gets blamed for something lol)
check your cache misses, I’m pretty sure they are outrageously high
edit: I just saw that it is in a handwritten memcpy? What’s the asm dump, does perf record show the same line? That entire paragraph up top is wrong. I thought that was your code iterating over the multidim arrays. Could still be that line have severe cache miss rates.
Those three tables there are almost 8Ms. You are definitely going all the way to L3 cache if not out to memory. Fix that, and this might go away.
The problem is actually the same as proposed by IntegratedQuantum and the solution of using
cm_hist = (&self.sc_counter_table)[p_piece.toU4][parent.to][piece.toU4()][move.to];
solved the problems. The difference now was to use profiler to find which reads from the tables need to be changed. History tables were the most problematic, but there were also others. Strangely not all of the tables. With a systematic approach of using profiler to find the hotspots I was able to reduce the use of memcpy down to 2%.
Now the engine runs with expected node count per second. I still find it strange that going from one dev version to another needs such a radical change. Also the code looks a little bit strange, because for some tables I use (&table)[i][j] and for others old way of table[i][j].
Thanks to all
I have not seen the code, but maybe you can pass these table parameters as pointers into some functions, rather than the variable itself? Perhaps this would be enough for the compiler to avoid making extraneous copies.
That is an old bug and seems like there is no interest in fixing it.
That it is happening with single dim arrays too makes me think zig isn’t generating a base+displace+offset or base+index*scale address which is what I would normally expect from an array inside a struct.
There seems to be interest in fixing it. For example andrew opened sometimes there is an unwanted memcpy when passing large structs by-value · Issue #17580 · ziglang/zig · GitHub (it appears to be a similar problem) where he said “I am making this a high priority issue”.
It just seems that this problem is non-trivial to fix and would require some more fundamental changes.
Running around here, I just ran into exactly the same problem I believe.
It looks like accessing the array directly is slow??
var keys:[64][225]u64 = undefined; // yes yes, is initialized

pub fn key_of(letter: Letter, square: Square) u64
{
    const k = &keys; // without this SLOW!
    return k[letter.as_u6()][square];
}