Zstd performance benchmarking correctness

Hey! I’m currently working on Zstandard decompression performance issue, whose goal is to benchmark the Zig std Zstd decompression implementation, compare it with the reference C implementation, and possibly propose improvements.

I’ve already done some work on this, but I’m not confident that all the decisions I made along the way were justified and the results I got were valid. So, I’d like to discuss a few things with the community here before reopening the issue on Codeberg. I’d be glad to hear any opinions or suggestions about the issue in general or about the results I present below.

First of all, the results I currently have:


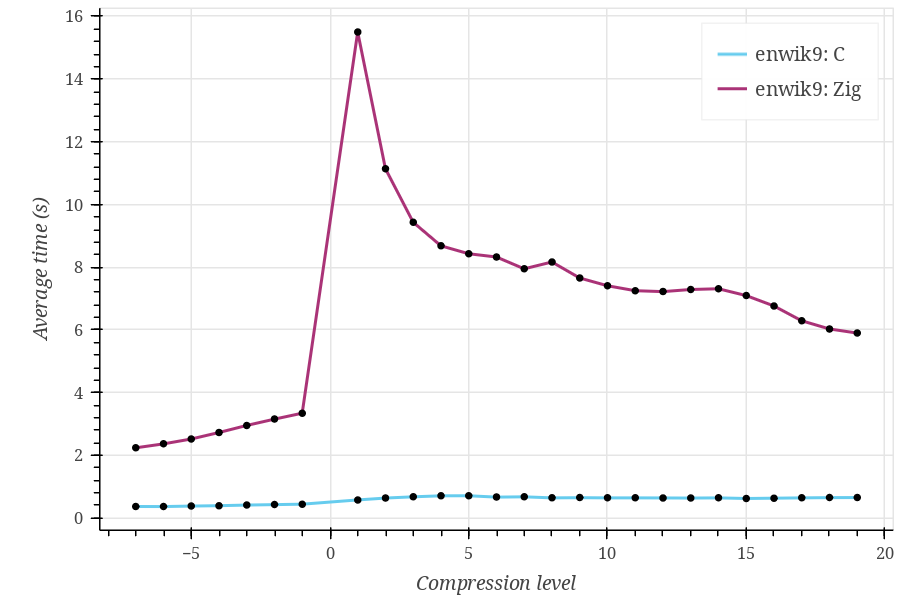
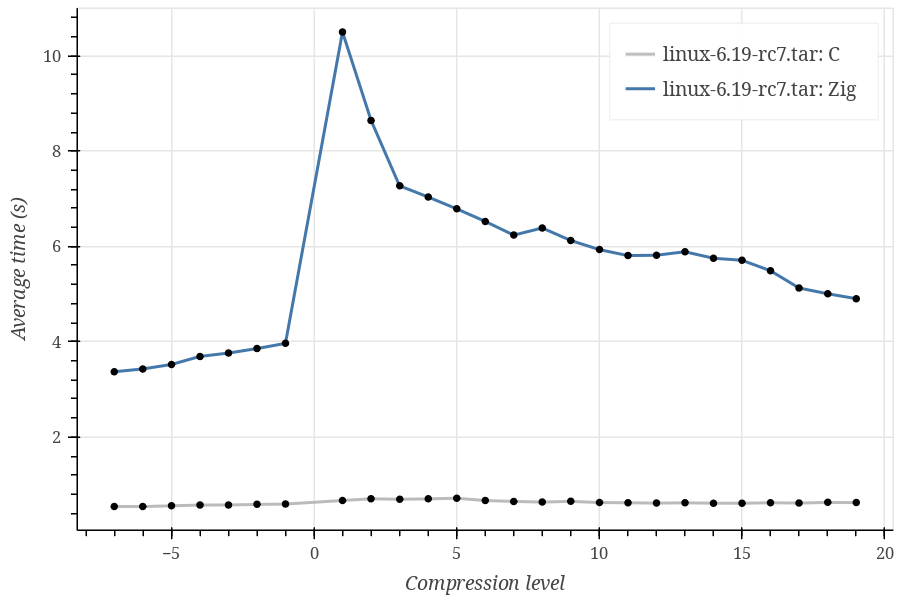
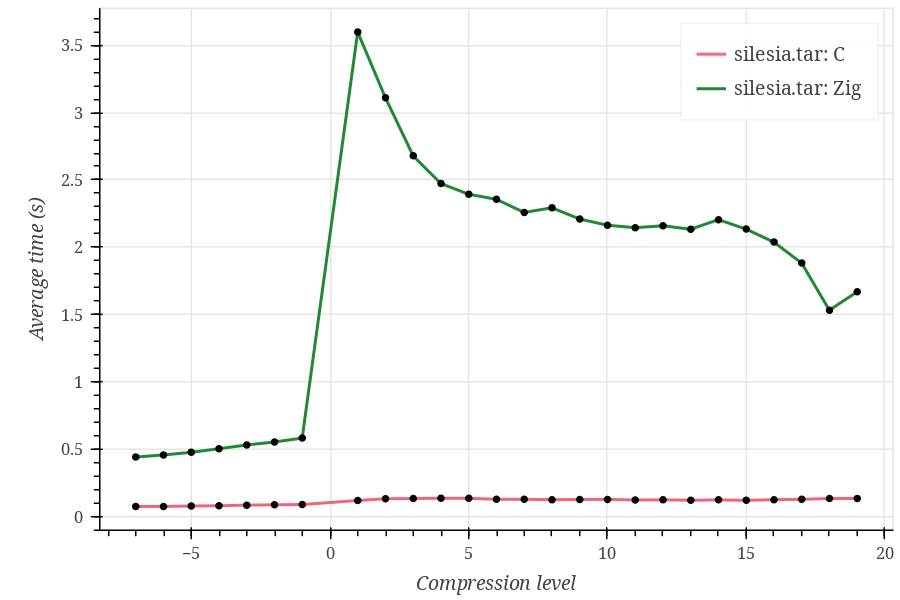
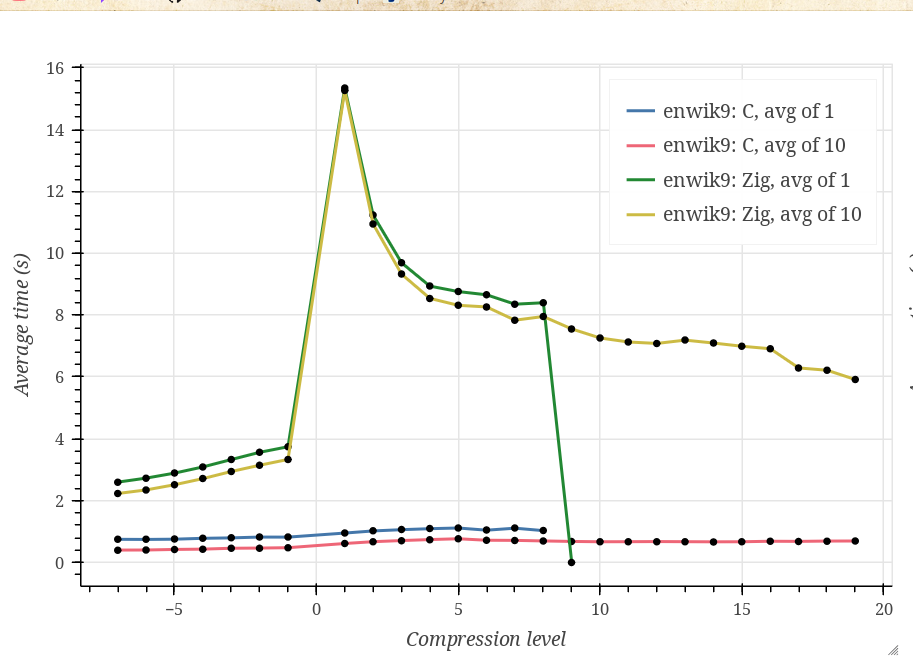
Compression levels go from -7 to 19 because the current Zig Zstd implementation does not support the ultra compression (20-22) levels, as far as I understand.

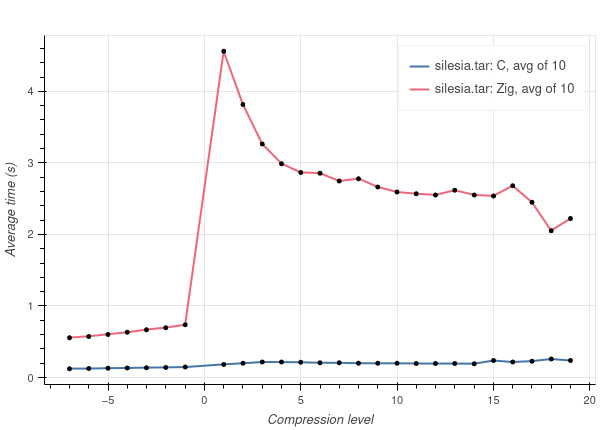
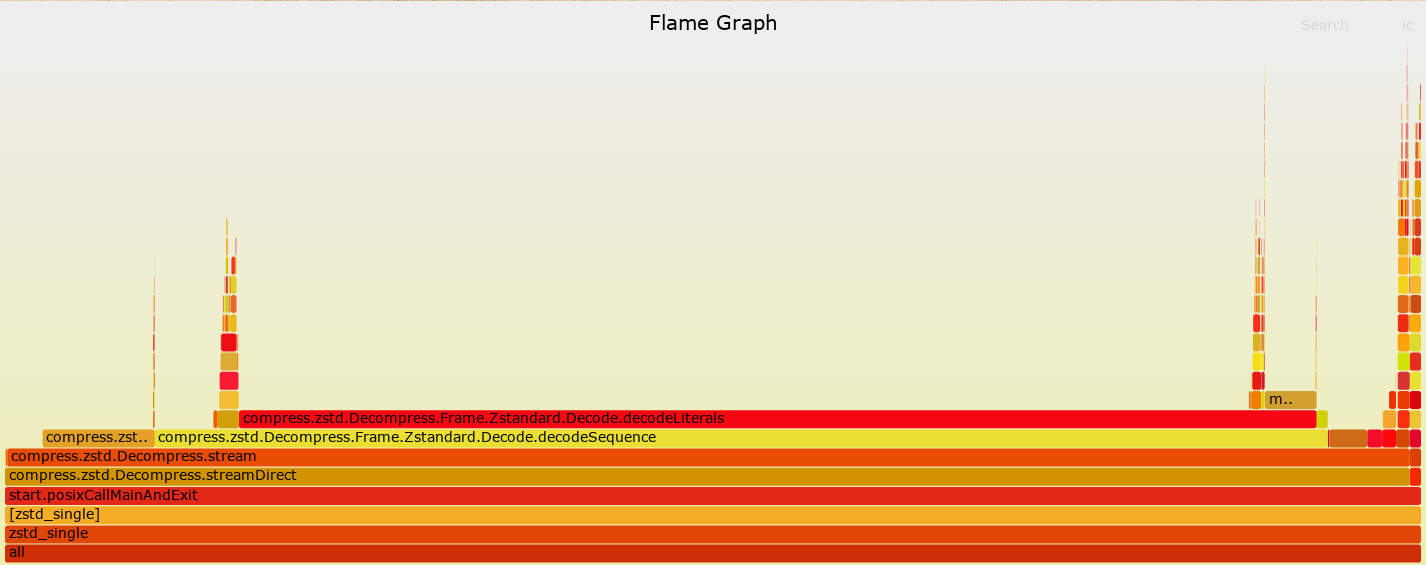
As you can see, Zig performs significantly (~10 times) worse on every tested dataset, and I can’t tell whether this is expected. Also, the Zig curve looks strange, having a huge spike at compression level 1 and rapidly decreasing at higher compression levels.

  1. Datasets I used are Silesia corpus, enwik9, and Linux kernel v6.19-rc7 sources. The first is used in the lzbench, which is referenced on the Zstd implementation GitHub page, while the other two just seemed reasonable choices, although I don’t have a strong justification for them.
  2. The issue proposes either adding a benchmark utility (which I assume would look pretty much like lib/std/hash/benchmark.zig), or adding a benchmark to gotta-go-fast. Gotta-go-fast hasn’t even been ported to Codeberg yet and hasn’t been receiving any updates for 3 years, so I’m leaning towards implementing a standalone benchmark utility similar to std.hash.
  3. I’m currently building the Zstd master branch with standard make options (which default to -O3 optimizations), then linking the produced library statically with the Zig executable, and building it with -Doptimize=ReleaseFast. All benchmarking is performed in Zig using the following code snippets (czstd.decompress is a wrapper around ZSTD_decompress):
/// Decompress ZSTD compressed bytes to out n times with libzstd.a and return total time elapsed in seconds
fn benchC(compressed: []const u8, out: []u8, n: usize) !f64 {
    var timer = try Timer.start();

    for (0..n) |_| {
        _ = try czstd.decompress(out, out.len, compressed, compressed.len);
    }

    const elapsed_ns = timer.read();
    return @as(f64, @floatFromInt(elapsed_ns)) / time.ns_per_s;
}

/// Decompress ZSTD compressed bytes to out n times with zstd.zig and return total time elapsed in seconds
fn benchZig(compressed: []const u8, out: []u8, n: usize) !f64 {
    var timer = try Timer.start();

    for (0..n) |_| {
        var writer: io.Writer = .fixed(out);
        var comp_reader: io.Reader = .fixed(compressed);
        var zstd_stream: Decompress = .init(&comp_reader, &.{}, .{});

        _ = try zstd_stream.reader.streamRemaining(&writer);
    }

    const elapsed_ns = timer.read();
    return @as(f64, @floatFromInt(elapsed_ns)) / time.ns_per_s;
}

There are, of course, a lot of other options for building things for benchmarking. For example, I could build a C binary and a Zig binary and benchmark them with external tools, or benchmark the C implementation in C, and the Zig implementation in Zig. I’m not sure whether it matters.

  1. As you can see, I include io.Writer and io.Reader initialization inside the timed section of the Zig implementation. I’m not sure whether the compiler fully optimizes this, but at least it should have a very minor overhead.

  2. I run each test case 10 times, and verify correctness only once at the end.

Benchmarking host specs:

  • Gentoo Linux, x86_64, AMD Ryzen 5 5600X
  • Zig 0.15.2 binary
  • Zstandard v1.5.7

Git repository with current state of work. It contains short README on how to reproduce results.

2 Likes

Do you get sane results if you run each test case only one time (that is 1/10 of the 10 times run time)?

Just to be sure, are you going through build.zig for this? If you aren’t (i.e. you’re using zig build-exe directly), then you aren’t actually compiling the Zig code in ReleaseFast mode, as -D means something else entirely in those commands (-Doptimize=ReleaseFast defines the C macro optimize to have the value ReleaseFast).

Relatedly, it would be helpful to post the full source code of your benchmarks so others can reproduce your results.

Yeah, I’m using the build.zig file. I’m sure the project is built with ReleaseFast because sometimes I accidentally start benchmarking without -Doptimize set, and the difference is immediately noticeable (the C implementation runs as usual, while the Zig implementation is very slow, as expected).
I don’t want to post the full source code yet because it’s still WIP and very messy. I’m going to make the Git repo public a bit later. If you think it is important to do it right now, I can, of course.

1 Like


More or less, yes. (Don’t mind the last point — I interrupted the run)

Are you using the native code generation, or LLVM (clang)?

Perhaps a pointer to the code and build (at least for the tests) would help diagnose.

You can get more insight using a statistical profiler to run your benchmark for n=10 level=1. During the ~2 minutes of run time the profiler can capture stack traces, then you can visualize the results using a cpu flame graph.
See: Benchmarking

I’m using native build, as is the default for the x86_64 architecture in Zig 0.15. I’ve just tried setting .use_llvm = true and got pretty much the same results.

I’ve decided to make the Git repository public. I’m adding the link to the original post now.

1 Like

If you’re including io in the parts you’re profiling, then you’re profiling io, not the compression algorithm. If io is included in one and not the other then your benchmark isn’t a fair one. Actual IO is always orders of magnitude slower than memory operations.

It’s a fixed reader and fixed writer. No syscalls are being called.

1 Like

Here are the results I got (I used the zstd built from the zstd submodule to generate the compressed files):

Command used to generate the files:

./zstd/zstd data/raw/silesia.tar -1 -o data/compressed/1/silesia.tar.zst

etc

A lot of room for improvement for sure.

EDIT: Didn’t realize --fast=1 corresponds to compression level -1, --fast=2 is -2, etc. Updated results with negative compression levels included.

2 Likes

In case it’s helpful for profiling, I’ve added a version of the benchmark program that avoids all filesystem IO and just does a single run of 1 implementation:

https://github.com/squeek502/zig-zstd-benchmark/commit/d57906c6e8f6078a16d4918bb1ab25ee2e10b04e

That way you can do stuff like this (using poop):

$ poop './zig-out/bin/zstd_single c' ./zig-out/bin/zstd_single
Benchmark 1 (17 runs): ./zig-out/bin/zstd_single c
  measurement          mean ± σ            min … max           outliers         delta
  wall_time           302ms ± 4.10ms     296ms …  309ms          0 ( 0%)        0%
  peak_rss            287MB ± 81.0KB     287MB …  287MB          0 ( 0%)        0%
  cpu_cycles          744M  ± 4.43M      739M  …  755M           1 ( 6%)        0%
  instructions       2.20G  ± 29.5      2.20G  … 2.20G           0 ( 0%)        0%
  cache_references   32.4M  ±  436K     31.9M  … 33.4M           0 ( 0%)        0%
  cache_misses       1.11M  ± 39.6K     1.06M  … 1.22M           1 ( 6%)        0%
  branch_misses      4.80M  ± 13.8K     4.78M  … 4.83M           0 ( 0%)        0%
Benchmark 2 (3 runs): ./zig-out/bin/zstd_single
  measurement          mean ± σ            min … max           outliers         delta
  wall_time          4.55s  ± 22.8ms    4.53s  … 4.57s           0 ( 0%)        💩+1403.6% ±  3.7%
  peak_rss            287MB ± 75.7KB     287MB …  287MB          0 ( 0%)          +  0.0% ±  0.0%
  cpu_cycles         18.5G  ±  109M     18.4G  … 18.6G           0 ( 0%)        💩+2385.7% ±  6.5%
  instructions       49.5G  ± 3.14K     49.5G  … 49.5G           0 ( 0%)        💩+2153.3% ±  0.0%
  cache_references   33.1M  ±  604K     32.4M  … 33.5M           0 ( 0%)          +  2.2% ±  1.9%
  cache_misses       1.52M  ±  114K     1.42M  … 1.65M           0 ( 0%)        💩+ 37.0% ±  6.3%
  branch_misses       134M  ±  160K      133M  …  134M           0 ( 0%)        💩+2678.8% ±  1.5%

or use it with stuff like hotspot, callgrind/kcachegrind, etc

Here’s the hotspot summary I got for what it’s worth (using the compression level 1 silesia.tar.zst):

(data recorded via perf record --call-graph dwarf -- ./zig-out/bin/zstd_single)

2 Likes