Hi.
I recently started using The RAD Debugger, and overall it’s been a good experience on Linux.
However, in zig it usually doesn’t work great mainly because zig doesn’t generate the full debug info for the program. For example:
const std = @import("std");

pub fn build(b: *std.Build) void {
    const target = b.standardTargetOptions(.{});
    const optimize = b.standardOptimizeOption(.{});

    const exe = b.addExecutable(.{
        .name = "zig_test",
        .root_module = b.createModule(.{
            .root_source_file = b.path("src/main.zig"),
            .target = target,
            .optimize = optimize,
            .imports = &.{},
        }),
        .use_llvm = true, // True to generate the debug info...
    });
    ....
}
pub fn main(init: std.process.Init) !void {
    const arena = init.arena.allocator();

    var arr: std.ArrayList(usize) = .empty;
    var count: usize = 10;
    _ = &count;

    for (0..count) |i| {
        try arr.append(arena, i);
    }
}
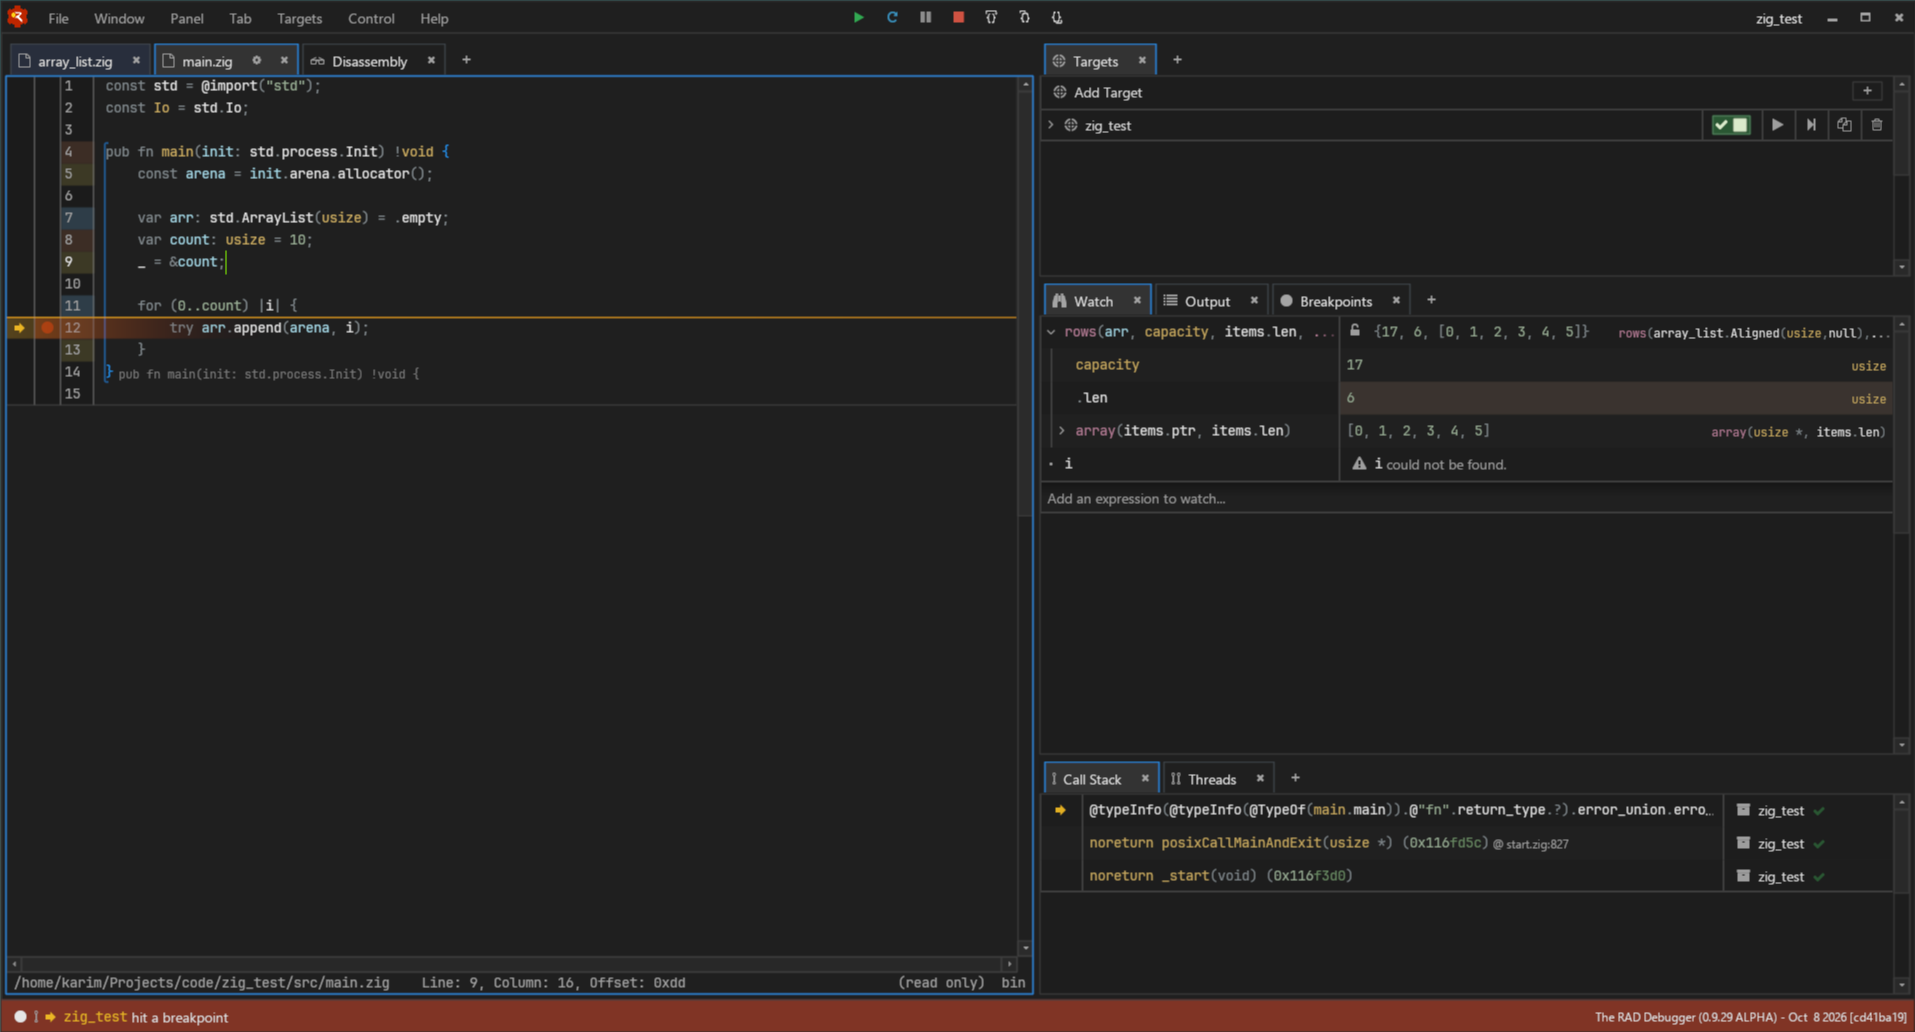
This is the simplest example I could produce. However, when I step through the code inside the for loop. i doesn’t have any info while arr has…
In my actual project, most of the functions only have debug info for the arguments and no debug info for any local variable.
I don’t now about linux but in windows unless i use the msvc toolchain (not the default in zig) the debugging experience with raddbg ends up being very bad.
What is wrong with the display of Arr? it’s an array list with a capacity of 17, len of 6 and a slice that contains your elements.
I mean, if Linux which has Tier 1 support is a subpar experience, I can’t imagine what it’s like on other platforms.
You are right, the variable arr has proper debug info. but the i variable in the for loop doesn’t have any debug info.
And this is just a small example, in the game that I’m making most of the variable won’t have any info at all…
What optimization mode are you building with ?
.use_llvm = true, // True to generate the debug info…
This only ensures that DWARF v4 data is generated. I don’t know what version Rad supports, but I’d guess at least v4, since it’s what gcc and clang emit. however if you at building with an optimization mode, it’s not surprising for debug info to be missing for variables such as i, which is a loop counter.
I believe setting strip is what will actually force debug info to stick around:
const std = @import("std");

pub fn build(b: *std.Build) void {
    const target = b.standardTargetOptions(.{});
    const optimize = b.standardOptimizeOption(.{});

    const exe = b.addExecutable(.{
        .name = "zig_test",
        .root_module = b.createModule(.{
            .root_source_file = b.path("src/main.zig"),
            .target = target,
            .optimize = optimize,
            .imports = &.{},
            .strip = false, // don't strip debug info
        }),
        .use_llvm = true, // True to generate the debug info...
    });
    ....
}
pub fn main(init: std.process.Init) !void {
    const arena = init.arena.allocator();

    var arr: std.ArrayList(usize) = .empty;
    var count: usize = 10;
    _ = &count;

    for (0..count) |i| {
        try arr.append(arena, i);
    }
}
That loop can be trivially unwound into 10 function calls. Even if you turned optimisations off, double-check the assembly output to make sure. I’ve had it happen in both C and zig code, and it does exactly what you report; the debugger can’t find the symbol (because it doesn’t exist, not even in a register).
Better than expected, honestly. I’m using it with an ESP32-S3 via OpenOCD, and it debugs just as well as with C code. That’s a Tier 4 target (XTensa).
Sorry for the late reply. However, .strip = false doesn’t solve the issue unfortunately. This is example was built in debug mode.
At first I also thought that the compiler somehow unrolled the loop in debug mode. That’s why I tried to make counter a runtime variable. I likewise checked the assembly and it wasn’t unrolled…
It’s truly weird. And again, the for loop was just an example, in my game all of my variable don’t have any debug info.
How are you distinguishing between “zig doesn’t generate debug info” and “the RAD debugger doesn’t support the debug info that Zig generates”?
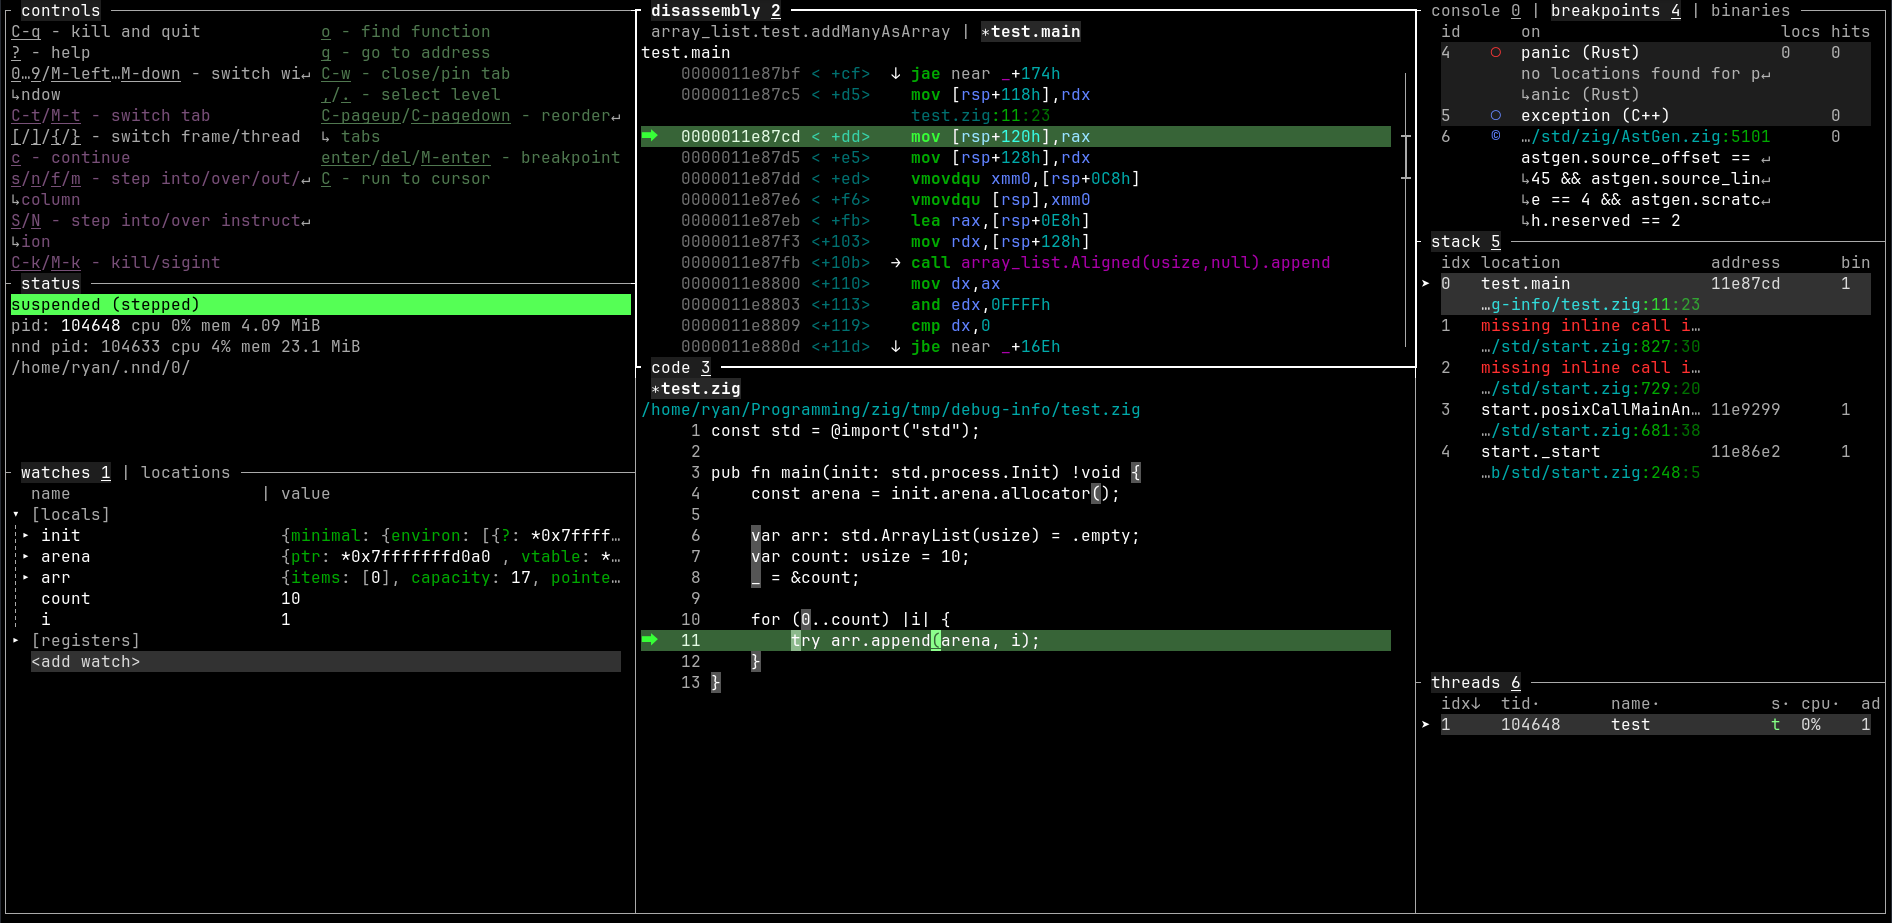
With nnd, for example, i shows up just fine (with self-hosted backend and with the LLVM backend):
Haha, it didn’t even cross my mind that the problem might be with the RAD debugger! Although, I’m working on two versions of my game just for the sake of comparison. One in Zig and one in Odin. In my Odin version, the debug info were available, so I immediately thought of it as Zig’s fault.
odin’s creator contribute for raddbg, so availabe is …