I have a simple game that I’ve built in Odin with Raylib. I started rewriting it in Zig and one thing that surprised me is how slow the builds are, the delay was annoyingly noticeable on each compilation. I benchmarked it and I got ~700 ms on average to build the project in Odin vs ~1.7 secs in Zig.
I mainly work on Apple Silicon M1. I asked Loris about my problem during his twitch stream and he suggested to try the amd64 machine to see if it’s better. So I tried my old Thinkpad with i5-8365U CPU and the build times were even worse there - ~2 seconds on average. Loris has also mentioned the -fincremental flag, but it somehow paniced when I tried to use it (did not investigate exactly why). But even if -fincremental worked, IIUC it only works in the watch mode, which doesn’t really fit my workflow, as I usually just invoke the compiler via a keymap in Neovim.
I then got curious and built a similar prototype in Rust (using the Raylib crate) and while the initial build was much slower, the subsequent invocations were surprisingly much faster - ~300 ms (even 2x faster than Odin).
Why is zig build so slow? Will it be improved any time soon?
The reason zig build is so slow even for tiny program is because it has no precompiled standard library that gets linked seperately. Last time I checked most of the time was spent compiling the dwarf debug info parser. (you can check this yourself with zig build --time-report)
It will get much better with incremental compilation, where it only recompiles the functions that you changed. But, as you experienced, right now incremental compilation is still incomplete, it works on some projects if you are lucky, but not on all of them. Support will improve over time, and I’d suggest to try again after the next Zig release.
IME initial vs build times depend on a lot of factors:
building build.zig generally seems to be slow, but that only happens once or after changing build.zig
the LLVM backend is slow, especially with optimization e.g. on Macs that’s the default for all build modes, on Windows LLVM is still the default for release mode (AFAIK)
for building C code in debug mode, Zig activates strict C compiler flags which slow down compilation (for instance UBSAN)
I have the impression that on macOS, linking is slower than it should be and is the bottleneck for regular builds (e.g. no complete rebuilds)
compilation on Windows also generally seems very slow for me, maybe the Zig compiler/linker does file access patterns that are not particularly ‘NTFS-friendly’
on some platforms and when C or C++ code is involved, an initial build also takes very long since MUSL and/or libc++ needs to be compiled (but that also only happens once)
…also I think/guess that most Zig team peeps are doing most of the development work on Linux, and Linux is so incredibly fast with filesystem-heavy work that problematic filesystem access patterns on other platforms might not cause issues.
For context, I did not mess with build.zig, I was only changing the project source files when performing the measurements. zig build is fast on repeated invocations but whenever I make a small code change like updating a global variable value, the build time gets back to ~1.7 seconds.
…also I think/guess that most Zig team peeps are doing most of the development work on Linux, and Linux is so incredibly fast with filesystem-heavy work that problematic filesystem access patterns on other platforms might not cause issues.
FWIW, I have Linux on my Thinkpad and as I mentioned, the build times were even worse there.
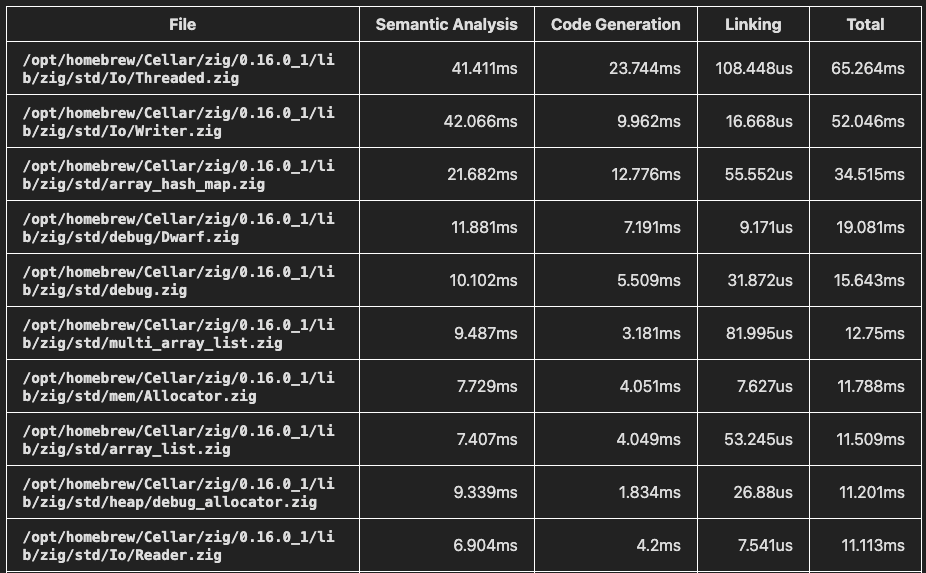
Thanks for the clue. I ran zig build --time-report and the dwarf debug info parser is not nearly as bad as Io/Threaded.zig and Io/Writer.zig.
Here’s what I’m getting:
So, there is currently an issue, because of the std.Io system introduced recently, that quite a lot of standard library code gets called in unnecessarily on projects that don’t use much of it. That’s making small programs bigger than they need to be and, because it’s a fair amount of code, makes short builds longer than they need to be.
Two good things:
There are ideas floating around on how to solve this in the dev team.
It’s a constant cost that won’t get bigger as your code gets bigger.
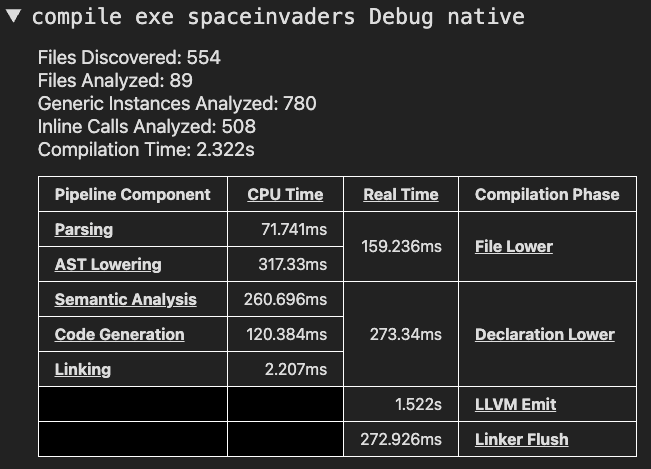
Most of your time is the LLVM Emit Object though. At 1.5 seconds of your 2 seconds, that’s the primary problem. It’s LLVM code though and the team can’t do anything about it except replace it… which is the plan, but the ARM backend isn’t there yet and the x86 one still is still new and only being used for debug builds.
FWIW in my chipz project I also see 1.7 sec for a trivial change in Zig code, and running with --time-report the issue is clearly the LLVM passes, 1.5 out of overall 1.7 seconds is spent in LLVM:
…I guess the difference to other LLVM-based languages is that LLVM always works on the Zig output for the whole program, not just a small part (not sure how Odin and Rust do it, afaik Odin splits work into ‘modules’ and Rust into ‘crates’.
That doesn’t explain your x86-64 results on Linux though, unless LLVM is somehow enforced.
I’ve been wondering about the same about Zig builds as I see comments where some insert_largish_project_here builds in milliseconds, and then I build my fairly simple game project on macOS M3 and it takes several seconds like below.
My project is a mix of C and Zig though, including the SoLoud C++ library, Sokol (+Sokol zig), Lua (via ziglua), and some of my own C code.
I looked at the time report for my build and quite surprisingly found out that the translate-c lua_all phase takes 620 ms. I suspect it’s processing this file - I think I would’ve expected this to be faster.
But as discovered earlier in the thread, it looks like LLVM dominates the numbers.
PS. The time report would be a bit easier to use if it reported “Compilation Time” also in the section heading and in the top most summary.
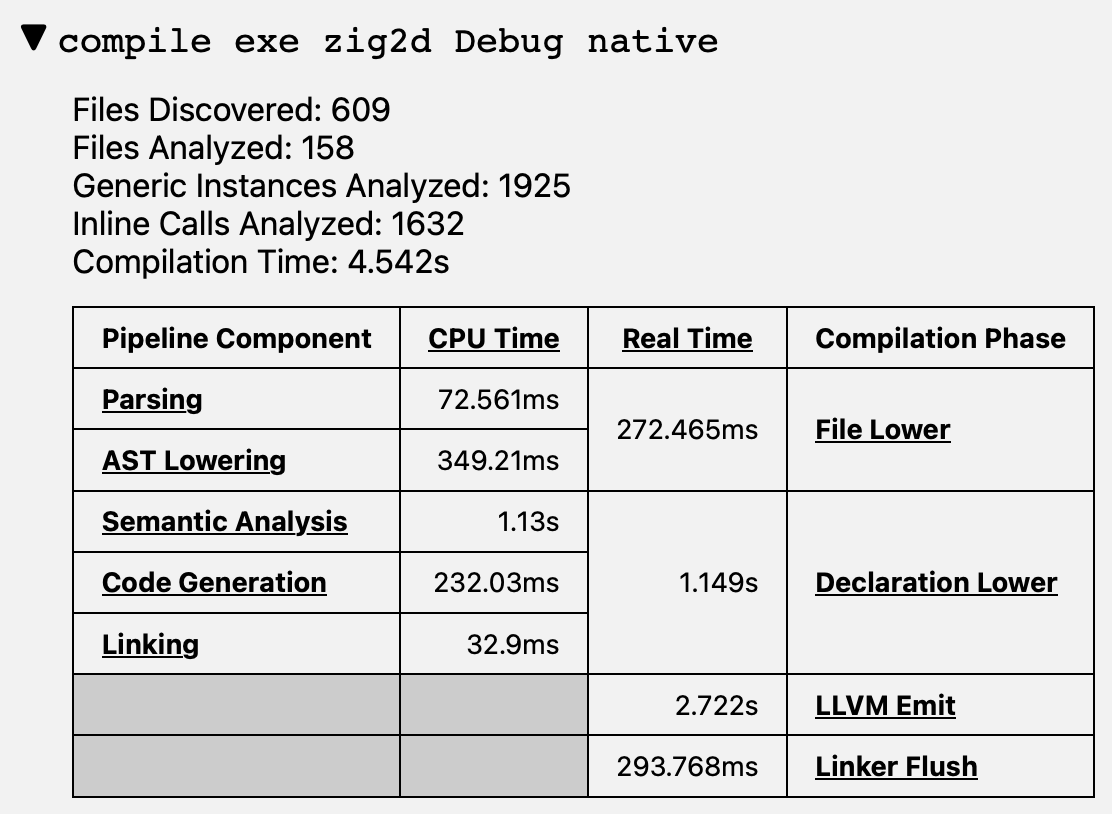
I upgraded my Linux machine and tried out the incremental build. Got my project building, but alas it’s failing on some odd build issues when I enable -fincremental. But the overall compilation time is down from 4.5s to 1.25s without -fincremental, so that’s already a big win!
Oddly though, the translate-c part of the zlua library is taking 0.8s which seems oddly high. That’d be easier to provide a repro - maybe I’ll try to dig into that a bit.
I think we do not have enough information on whether that is actually true. It’s easy to say llvm slow, therefore Zig slow, but that’s not necessarily true.
When I investigated compile-time performance in my project a while ago I’ve come to the conclusion that it’s not just llvm, but it’s also the fact that too much code is generated from comptime duplication everywhere, allocators, data structures, printing, they all emit the literal exact same assembly code hundreds of times (note that allocators and most data structures only care about size + alignment, printing cares about only some of the text).
If you’re using 0.16 that’s somewhat expected as I also had some problem there. I haven’t had any problems on the current master branch though, but I wouldn’t advise you going choosing this path as their is more breakage and more bugs are expected.
I hope that when they revise the standard library that most things are based on type-erased structures. They’ve already begun doing this with the Io.Queue and Io.Writer for instance.
What I’m doing to accomodate this is I have a build step that compiles only and run it in another terminal/window/whatever with -fincremental --watch and map my default “launch the stuff” mapping to simply invoke the binary in zig-out/bin.
If find it extremely convenient.
I got to test that with Raylib backend in dvui, on zig master branch, so I expect this workflow to become standard on linux_x86_64 once 0.17 is tagged.
Actually I even expect that zls will basically do that for you once the blocking point in master branch is lifted.
I guess realistically speaking, it will take time to see these benefits on all platforms, as it all depends on tight integration with the linker.
If you want to give it a shot with zig master with the new linker, you can use my Raylib fork that should work with latest Zig. (Maybe check the Raylib decl of the build.zig.zon in here : update for zig 0.17 by Yinameah · Pull Request #914 · david-vanderson/dvui · GitHub - sorry, I’m not on my computer that was the easiest way to share)
As previously stated, this is a bit of a rabbit hole but at least if you run into linking issues I haven’t you get the chance to report it and see it fixed for 0.17
For Neovim specifically, I’ve got a simple build server set up that takes the output from watch and pipes it to the Neovim quick fix list. it’s pretty fast.