Visual Build Graph

I like that the Zig build system is Zig, but even after a year or so with Zig I still find myself lacking a mental model of the build graph.

For example, I don’t actually understand yet how the following effect my build graph:

  1. Step
  2. Compile
  3. ResolvedTarget
  4. OptimizeMode
  5. Module
  6. Run

I’m still copy-pasting build code that I know works, either from the documentation or from a previous project without fundamentally understanding it.

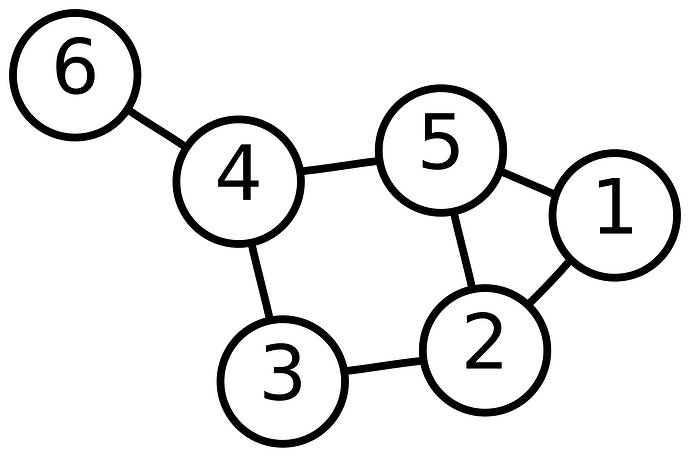
Perhaps something that could jump-start me is a visual build graph representation? Something like this:


(source: Graph (discrete mathematics) - Wikipedia)

  1. Has anyone worked on such a tool?
  2. Do you think it would be useful?
  3. What would the tool output, an SVG?
  4. Could such a tool be constructed that would not have to be part of the zig compiler? Would a bundled zig compiler be required for this tool?
  5. Is a “graph” the correct representation of the build process?
  6. What type of graph is the build process? Directed graph? Is there a root node?
8 Likes

I don’t know if anyone worked on this, but I vaguely remember someone making something similar. From my understanding every build tools (make, build.zig, just etc…) are just a way to build a DAG (Directed Acyclic Graph) Meaning that whatever steps, or things that you need to do, there should always be a starting point, and an ending point. So for example when you have something like this :

pub fn build(b: *std.Build) void {
    const target = b.standardTargetOptions(.{});
    const optimize = b.standardOptimizeOption(.{});

    const lib_mod = b.addModule("zdt", .{
        .root_source_file = b.path("src/root.zig"),
        .target = target,
        .optimize = optimize,
    });

    const lib = b.addLibrary(.{
        .linkage = .static,
        .name = "data-structures",
        .root_module = lib_mod,
    });
    b.installArtifact(lib);

    const lib_unit_tests = b.addTest(.{
        .root_module = lib_mod,
    });

    const run_lib_unit_tests = b.addRunArtifact(lib_unit_tests);
    const test_step = b.step("test", "Run unit tests");
    test_step.dependOn(&run_lib_unit_tests.step);

    const lib_check = b.addLibrary(.{
        .linkage = .static,
        .name = "data-structures",
        .root_module = lib_mod,
    });

    const check_step = b.step("check", "zls helper");
    check_step.dependOn(&lib_check.step);
}

The way I think about it is that you have the entry point which is the command eg. zig build. This then compiles the build script, to build the DAG, so you start to resolve what build means, here for example, it’s building the static library, that library depends, on static linkage and the module lib_mod, which itself depends on whatever code is in src/root.zig which itself may depends on arbitrary large file strucuture, once that’s resolved the lib_mod also depends on target and optimize which depends on the cli arguments, and the native or specified target.

It’s probably more complex than that but at least that’s how I view it, and I’m pretty confident that’s a good enough approximation.

But if you wanted I think that nothing prevents you from using something like Raylib to visualize the entire build graph.
I have used graphviz for similar purposes in the past, and it works really well. You could either directly work with a zig / C binding, or generate dot commands which will create your graph for you. Highly recommended.

4 Likes

I’ve been looking into cool things to do with zig’s build graph info…

dasimmet/zig_pkg_tool

This repo and tool bundles a custom build runner, that will, instead of building the given targets, output a .dot file for graphviz.
The output depends on the cli arguments of the build though, so integrating into the build system is not really possible.
If someone were to build graphviz with zig it would be awesome to bundle this step :wink:

3 Likes

When I’ve auto-generated dependency graphs in the past, I’ve done so with PlantUML. Which is an awkward and frustrating tool, but happens to have purpose-build grammar and layout logic for this purpose. The results usually make more sense than generated .dot files.

It’s Java based, so incorporating it into a Zig lib would be nontrivial. I’d just assume it’s there and call it like any other process, personally.

Yeah i wouldnt want to get into plantuml ;-/
One feature of the conan package manager is it outputs an interactive html graph directly: conan graph info -f html

generating something like that would be pretty cool

You can. PlantUML remains the best tool for the job.

Personally, I use this code to convert build.zig.zon to json format: Convert build.zig.zon to json · GitHub

Then you could use shell script to do whatever you want.