Indeed something like this happens. I use a BufferedWriter.
I thought that would be faster
I now see that when running as administrator the speeds are the same.
Side effect is that my “print colored” to console does not work. it is all black and white. No ansi coloring.
I need to remove console color printing anyway.
The native Windows console host is notorious for being slow and will incur overhead when scrolling the screen buffer. The vscode console might be optimized differently.
I use a BufferedWriter.
I thought that would be faster
It should be.
Normally when people report speed differences between running in an IDE console and running without it, it’s because the IDE will buffer the output more aggressively.
I wonder what is the optimal way to do things.
I’m not super familiar with Windows-specific things, but honestly, I’d just avoid console output entirely, if you can. Console IO is almost always one of the slowest operations you can do, no matter how you do it.
I know an old trick is spinning up a thread to do the IO for you and enqueueing messages to that thread from your main program. That could maybe help.
There are alternatives to the default cmd.exe on Windows, no?
I seem to remember that Alacritty had a Windows version, but I am confident that there are many others, even powershell would be an existing alternative that could be used to try and make sense of where the problem lies, and if it is indeed the fault of cmd.exe, or something else being overlooked.
Even microsoft people have finally tried to improve upon their terrible existing terminals, supposedly this one should be a bit better then the old ones:
But I can’t know for sure, I haven’t tried it.
(Well below Casey seems to compare refterm against the preview of Windows Terminal, I am not sure if the final release has gotten better, but if not then maybe try to use some other third party terminal)
My solution is to never ever run windows as a user, but instead only in a vm if I need to test whether some program runs on windows.
So I can’t give you practical advice for using windows, I abandoned it almost two decades ago.
You also could try to use a profiler to find out exactly where it is slow, but before wasting time doing extensive analysis, I would try to find a way to run it where the problem disappears. The windows included terminals are notorious for being terrible from a performance standpoint.
It is more from the Zig standpoint I would checkout what can be done.
for printing output I just use std.io.getStdOut().writer().
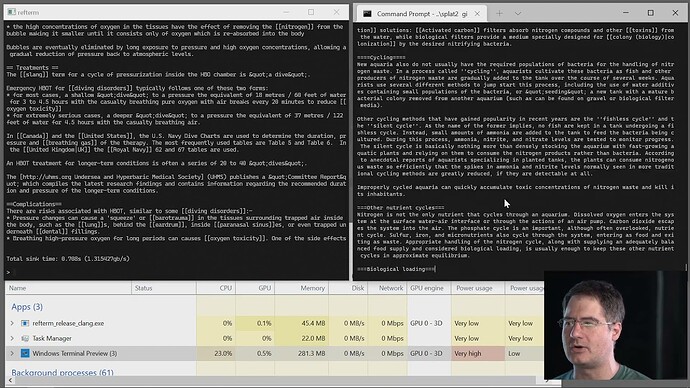
When I compile on this window machine I get the default windows terminal window.
Yeah and we are saying you should get a non-terrible terminal and execute your program from there, if the speed difference disappears then something about this
is probably incorrect.
Because something is causing a speed difference and it is likely something connected to io and the terminal that is used for output.
Alternatively you could also not print at all and instead log to a file.
But I vaguely remember from refterm: Refterm playlist
that even with file writing there where some performance bottlenecks with certain APIs, just don’t remember the details. (apparently something called fastpipes helps make it faster)
Well maybe you are even experiencing this (timestamped):
Yes probably! “Bypass standard IO” I am not going to do…
Another thing was in my main function:
// version 1
fn main() !void
{
    run_chess_speed_test(); // 1200 million nodes per second
}

/// version 2
fn main() !void
{
    run_chess_speed_test(); // 850 million nodes per second
    run_io_loop();
}
which I think is very strange.
Running windows terminal as administrator also speeds up quite a lot, which is insane in my opinion. Testing other chess engines (Stockfish, Gigantue) I noticed they were a bit slower as well.
Questions remain. What can I do in Zig to maximize the speed, io not interfering too much.
Of course outputting something to the terminal messes up the cpu-cache etc. so probably there is nothing to do.
I think you need to start using more tooling for example sampling and tracing profilers.
Maybe try to use tracy.
I think if you want to make progress you need to make more detailed measurements, better benchmarking tools, or profilers can help with that.
If the speed test measurement itself doesn’t have a problem, then there still could be a number of things causing different throughputs (ideally you would measure more than just throughput):
program being scheduled and switched between different cpus mid execution, causing varying additional latency added by the OS (should be visible with profiling tools)
fix: pin the program on a single core, or use tools that distinguish between wall clock and actual runtime
running the program on cpus with varying clockspeeds
fix: set the cpu clock speed to a fixed value, during program execution
address space layout randomization, causing different things in the program to be slow
fix: have enough independent runs so that the variance between different runs gets washed out through determining the mean (ideally the profiler would re-randomize the layout during the run of the program)
For benchmarks you also want a tool that is able to record system calls, cache misses, branch misses etc. (so that you have an easier time spotting possible causes)
If you find good tools to use under windows you can also add those to the tools section of this doc, or add a comment:
Some people on random forum posts I found, have mentioned Windows Performance Analyzer | Microsoft Learn so that is another thing you could try, I am not on windows so I haven’t used it.
I just added a few more tools in the benchmarking page.
For Windows, there is PerfView. It is inspired by linux perf and is open sourced by Microsoft. It is widely used in windows because it works for .net applications as opposed to the much more complex Windows Performance Analyzer.
For perf, I added some links like Julia Evans Zine: Profiling and Tracing with Perf, and the Gnome sysperf (similar to hotspot).