Hi everyone,
I have another question for you. I’m currently building a VM and as I was profiling yesterday I ran into something I wasn’t expecting.
The VM’s stack uses a fixed size array and indexing the stack at runtime is done via a function call. When I profiled this, I saw a huge amount of time spent in a system call (I think?). I then tried different architectures for the stack and ended up trying an ArrayList instead. There were no more system calls resulting in a waay faster execution.
I did a little test in which I just do useless stack manipulation to show you what I’m talking about.
In the first program, I use a fixed size array for the values:
const Stack = struct {
    values: [256]usize,

    pub fn init() Stack {
        return Stack{ .values = .{1} ** 256 };
    }
};

fn get_idx(i: usize) usize {
    return i % 256;
}

pub fn main() !void {
    const stack = Stack.init();

    for (0..100000000) |i| {
        const a = stack.values[get_idx(i)];
        _ = a;
    }
}
When I profile this I have:
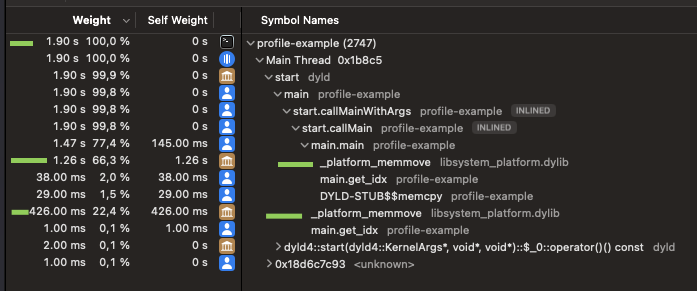
The vast majority of execution time is spent in “_plateform_memmove”.
Now, if I do this exact same thing but replacing fixed buffer by an ArrayList:
const Stack = struct {
    values: ArrayList(usize),

    pub fn new(allocator: Allocator) Stack {
        return .{ .values = ArrayList(usize).init(allocator) };
    }

    pub fn init(self: *Stack) !void {
        for (0..256) |i| {
            try self.values.append(i);
        }
    }

    pub fn deinit(self: *Stack) void {
        self.values.deinit();
    }
};

fn get_idx(i: usize) usize {
    return i % 256;
}

pub fn main() !void {
   var gpa = std.heap.GeneralPurposeAllocator(.{}){};
    defer _ = gpa.deinit();
    const allocator = gpa.allocator();

    var stack = Stack.new(allocator);
    try stack.init();
    defer stack.deinit();

    for (0..100000000) |i| {
        const a = stack.values.items[get_idx(i)];
        _ = a;
    }
}
I have this profiler result:
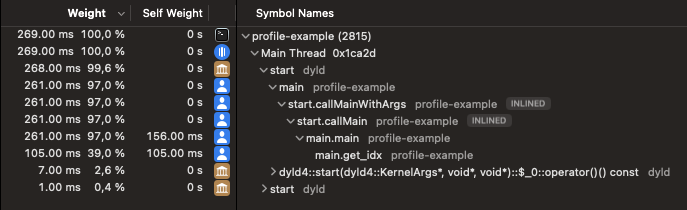
We go from a 1.9s of execution time to 269ms and it’s just because there is no more calls to “_plateform_memmove”.
I would like to understand why it behaves like this or what triggers those system calls to know exactly when or not to use an ArrayList (performance wise).
Edit: Just in case, I use zig version 0.14.0-dev.2577+271452d22 on MacOS.
Thanks!