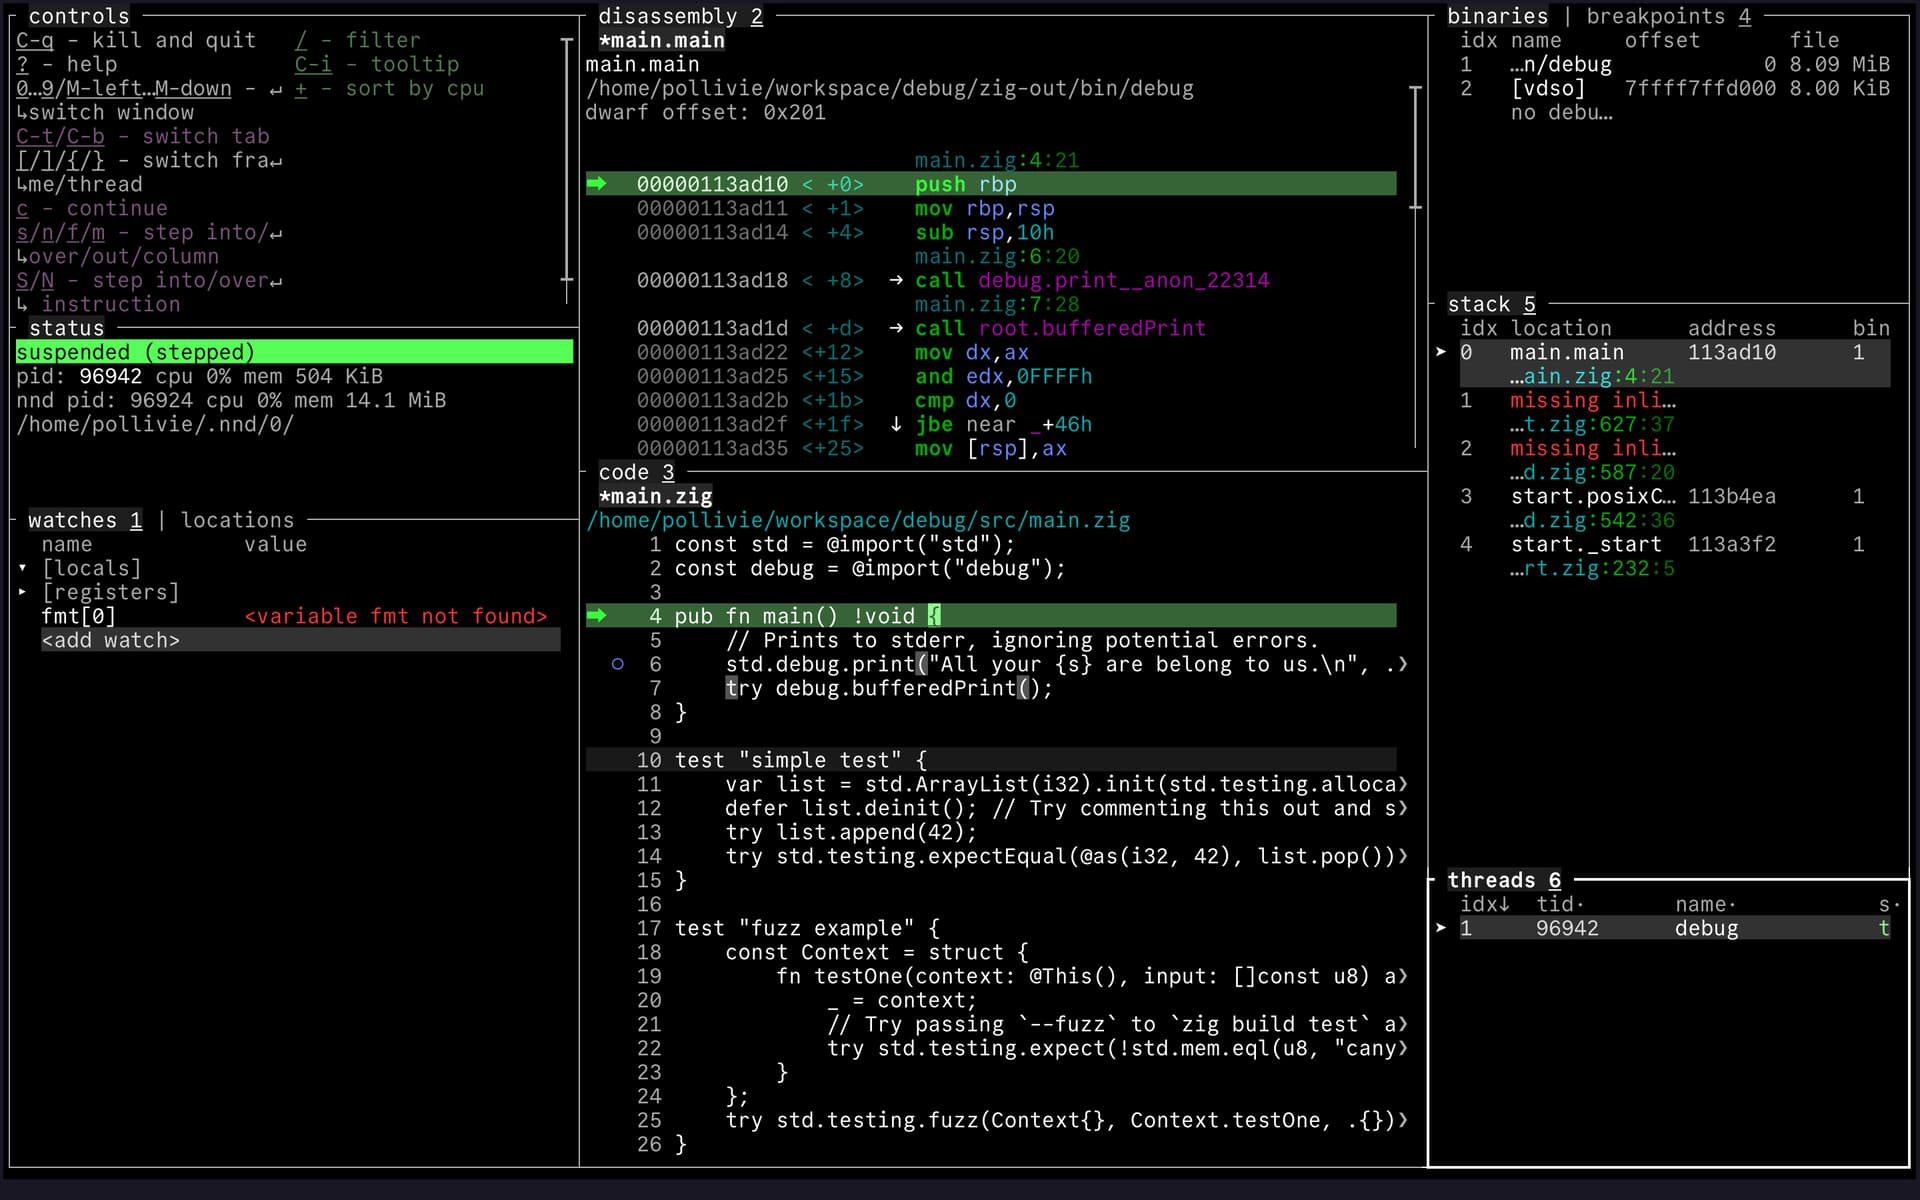
Just wanted to share a cool project I’ve found on github ![]()
I’ve been testing it a bit, and it works really well with Zig, out of the box.
Just wanted to share a cool project I’ve found on github ![]()
I’ve been testing it a bit, and it works really well with Zig, out of the box.
This seems great! Excited to try it.
It blows my mind how terminal output from your program completely breaks gdb’s (and I think maybe lldb’s) terminal UI. Does nnd fare better?
good question haven’t tested it yet, but the projects isn’t just a TUI wrapper around gdb and lldb, so maybe it might not fail to do that ![]()
Note that both gdb and lldb have various ways to redirect output, or log it.
For instance, you can open a second terminal window/pane, type tty to get the path, and then do (gdb) run &> /dev/pts/1 to redirect both stderr and stdout to the second terminal while debugging.
I had already tried with zig, but it wasn’t very acceptable.
That’s why I turned to lldb,
To see if all that has improved.
After testing, I’m keeping codeLLDB.
I was going to say “RemedyBG”, but that’s already in the first line of the readme ![]()
If you can suffer VSCode, CodeLLDB works well on the big three platforms (Windows, macOS, Linux), and it’s actually quite snappy (better than the Xcode debugger at least - which is curious because both are LLDB frontends).
There happens to be a documentation chapter about this:
% nnd --help-tty
The debugger occupies the whole terminal with its TUI. But what if the debugged program also wants to use the terminal in an interactive way?
E.g. how to use nnd to debug itself?

One way is to just attach using -p <pid>.

But what if you need to set breakpoints before the program starts, e.g. to debug a crash on startup? Then you can do the following:
 1. Open a terminal window (in terminal application or tmux or whatever). Let's call this window A. This is where you'll be able interact with the debugged program.
 2. This terminal window is attached to some 'pty' pseudo-device in /dev/pts/ . Figure out which one:
     $ ls -l /proc/$$/fd | grep /dev/pts/
    For example, suppose this outputs /dev/pts/2 . You can also double-check this with: `echo henlo > /dev/pts/2` - if the text appears in the correct terminal then it's the correct path.
 3. Pacify the shell in this terminal window (to prevent it from eating input):
     $ sleep 1000000000
 4. In another terminal window (B) run the debugger:
     $ nnd --tty /dev/pts/2 the_program_to_debug
 5. Now you have the debugger running in window B while the debugged program inhabits the terminal in window A
    (which will come to life when you resume the program in the debugger, `sleep` notwithstanding).

The latter approach is often more convenient than -p, even when both approaches are viable.

(This can even be chained multiple levels deep: `nnd --tty /dev/pts/1 nnd --tty /dev/pts/2 my_program`. The longest chain I've used in practice is 4 nnd-s + 1 other program.)
Hey, may I ask for a rough list of thing that went wrong / missing features?