Help understand why Zig implementation slower

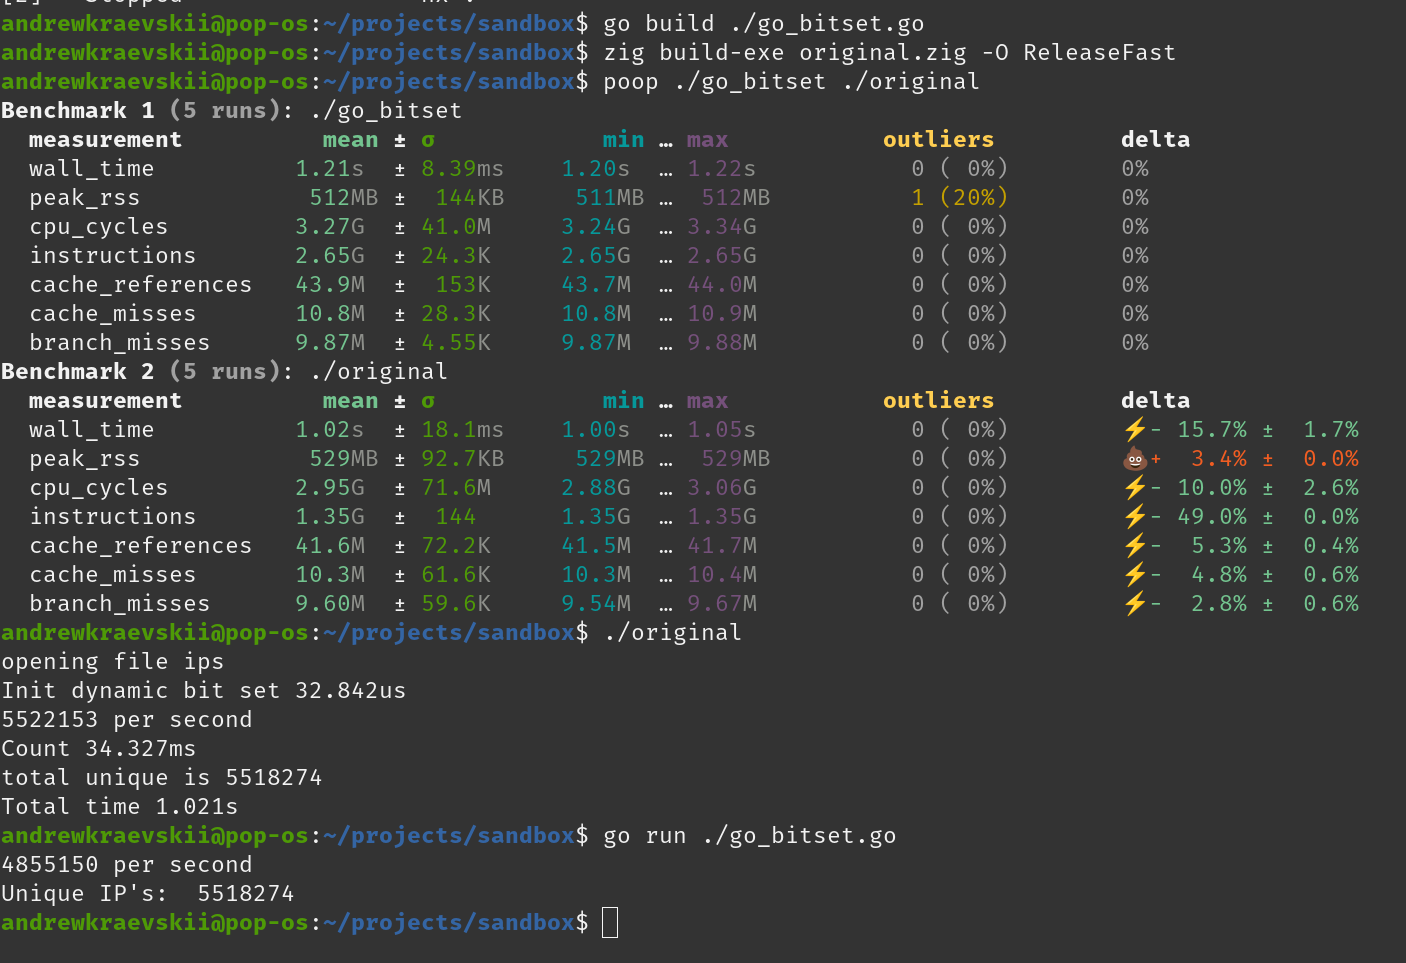
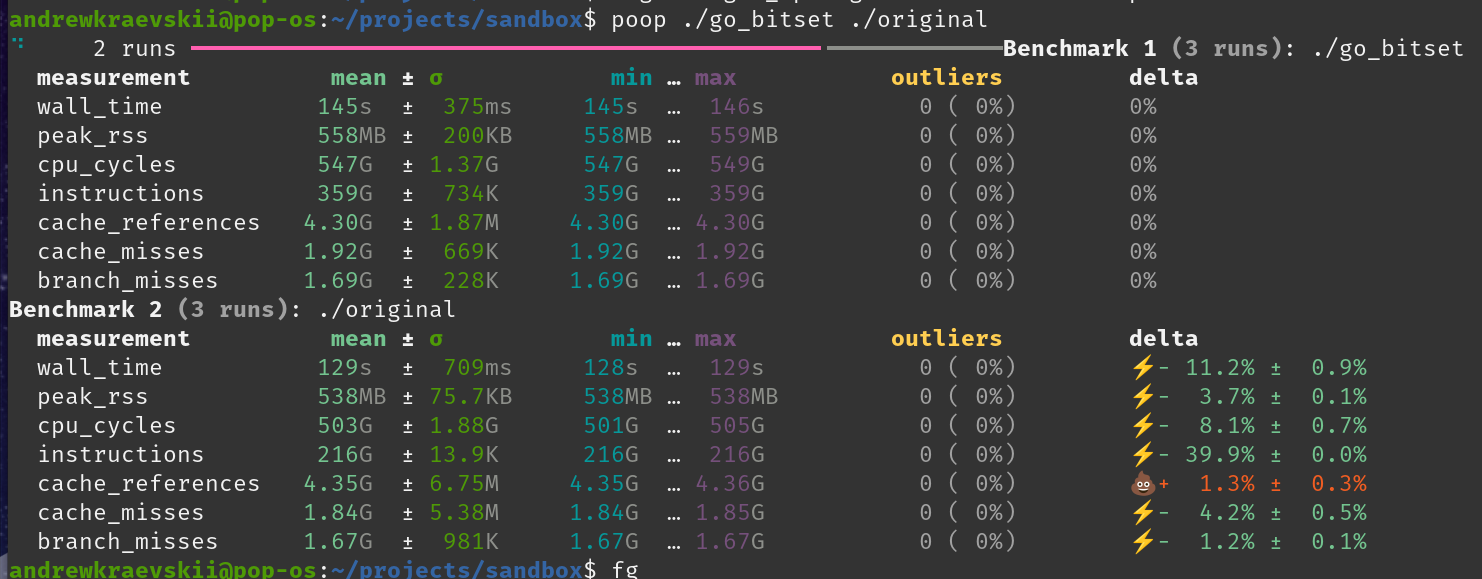
I have two programs one in Go and one in Zig. I believe the issue is in CPU intensive loop, but Zig cannot reach Go’s performance.

I think there’s a missing optimization in current Zig compiler? Release mode is on zig build --release=fast. Go version reaches 50M per second on my PC, but Zig 8M.

Here’s full Zig source code. I tried it with 0.15 and 0.16.0-dev.254+6dd0270a1 versions.

const std = @import("std");

pub fn main() !void {
    const gpa = std.heap.smp_allocator;

    var it = try std.process.argsWithAllocator(gpa);
    _ = it.next();
    const filename = it.next() orelse "small_set";
    std.debug.print("opening file {s}\n", .{filename});

    const file = try std.fs.cwd().openFile(filename, .{});
    defer file.close();

    var buf: [1 * 1024 * 1024]u8 = undefined;
    var reader = file.readerStreaming(&buf);

    var processed = std.atomic.Value(u32).init(0);
    const thread = try std.Thread.spawn(.{}, printStatsLoop, .{&processed});
    thread.detach();

    var set = try std.bit_set.DynamicBitSet.initEmpty(gpa, std.math.maxInt(u32));
    while (true) {
        const line = reader.interface.takeDelimiterExclusive('\n') catch |err| switch (err) {
            error.EndOfStream => break,
            else => return err,
        };

        const num = parseIpV4(line);
        set.set(num);
        _ = processed.fetchAdd(1, .seq_cst);
    }

    std.debug.print("total unique is {d}\n", .{set.count()});
}

fn printStatsLoop(processed: *std.atomic.Value(u32)) void {
    while (true) {
        const first = processed.load(.seq_cst);
        std.Thread.sleep(std.time.ns_per_s);
        const after = processed.load(.seq_cst);

        const per_second = after - first;
        std.debug.print("{d} per second\n", .{per_second});
    }
}

fn parseIpV4(line: []const u8) u32 {
    var ip_buf: [4]u8 = .{ 0, 0, 0, 0 };
    var ip_offset: usize = 0;
    for (line) |char| {
        switch (char) {
            '.' => {
                ip_offset += 1;
            },
            else => {
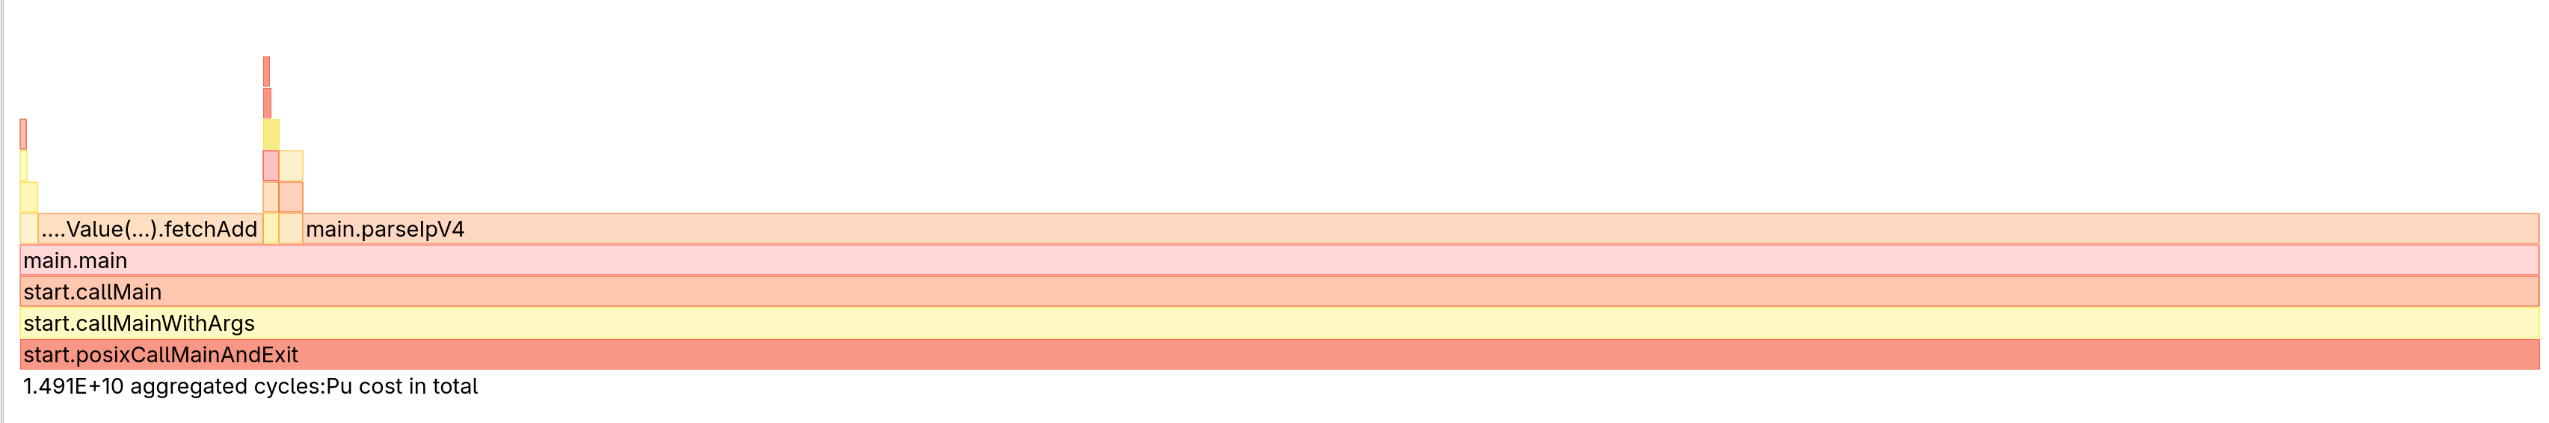
                // profiler says this line is responsible for 70% of time
                ip_buf[ip_offset] = ip_buf[ip_offset] * 10 + (char - '0');
            },
        }
    }
    return @bitCast(ip_buf);
}

I got this from linux perf record --call-graph dwarf

And this is Go implementation

package main

import (
	"bufio"
	"encoding/binary"
	"fmt"
	"log"
	"math"
	"os"
	"sync/atomic"
	"time"

	"github.com/bits-and-blooms/bitset"
)

func main() {
	fmt.Println("Unique IP's: ", UniqueIPs("small_set"))
}

func UniqueIPs(filePath string) int {
	file, err := os.Open(filePath)
	if err != nil {
		log.Fatal(err)
	}
	defer file.Close()

	bs := bitset.New(math.MaxUint32)

	var processed atomic.Uint32
	go statTask(&processed)

	scanner := bufio.NewScanner(file)
	scanner.Buffer(make([]byte, 16*1024*1024), 3*4+3+1+16) // 3*4 - numbers, 3 - dots, 1 - newline, 16 - just to be sure
	for scanner.Scan() {
		ip := parseIPv4(scanner.Bytes())
		bs.Set(uint(ip))
		processed.Add(1)
	}

	return int(bs.Count())
}

func statTask(processed *atomic.Uint32) {
	for {
		first := processed.Load()
		time.Sleep(time.Second)
		second := processed.Load()

		perSec := second - first
		fmt.Printf("%d per second\n", perSec)
	}
}

func parseIPv4(input []byte) uint32 {
	var ip [4]byte
	var ipOffset int
	for _, ch := range input {
		switch ch {
		case '.':
			ipOffset += 1
		default:
			ip[ipOffset] = ip[ipOffset]*10 + (ch - '0')

		}
	}
	return binary.BigEndian.Uint32(ip[:])
}

Example input data

97.71.173.241
97.71.173.235
161.71.174.27
215.10.61.107
161.71.174.29
227.215.10.99
161.71.174.30
215.10.61.63
161.71.174.31
1 Like

Can you share your build script too? --release=fast provides a release mode to the build script but it still must assign that value up to any executable it produces. (There are many cases in build scripts where the “main optimization mode” is not appropriate for various intermediate artifacts)

Generally I expect such a case as this to easily favor Zig over Go due to LLVM backend optimizations vs Go backend. I will be surprised if this is an optimized zig binary.

Here’s the build script, it was bootstrapped with zig init (removed comments for brevity).

const std = @import("std");

pub fn build(b: *std.Build) void {
    const target = b.standardTargetOptions(.{});
    const optimize = b.standardOptimizeOption(.{});

    const exe = b.addExecutable(.{
        .name = "ip_file_counter",
        .root_module = b.createModule(.{
            .root_source_file = b.path("src/main.zig"),
            .target = target,
            .optimize = optimize,
            .strip = false,
        }),
    });

    b.installArtifact(exe);

    const run_step = b.step("run", "Run the app");

    const run_cmd = b.addRunArtifact(exe);
    run_step.dependOn(&run_cmd.step);

    run_cmd.step.dependOn(b.getInstallStep());

    if (b.args) |args| {
        run_cmd.addArgs(args);
    }

    const exe_tests = b.addTest(.{
        .root_module = exe.root_module,
    });

    const run_exe_tests = b.addRunArtifact(exe_tests);

    const test_step = b.step("test", "Run tests");
    test_step.dependOn(&run_exe_tests.step);
}

perf seems a bit wrong in this case. Most of the time is spent in allocating DynamicBitSet.

> time ./original 
opening file small_set
Init dynamic bit set 230.297ms
total unique is 9
Total time 262.204ms

real	0m0.326s
user	0m0.054s
sys	0m0.270s

After further investigation it turns out all the time is spent calling @memset when allocating bitset.

My hypothesis is go version doesn’t do that since it assumes os gives zero filled memory. But don’t take my word for it.

EDIT:
the second biggest time lost is in bitset.count() method. Looking at go/zig bitset implementations they seem to work in exactly the same way. Not sure what magic go does to make it so fast

EDIT2: I only tested it on small_set provided so i only measure initialization time

1 Like

Oh, my use case is to parse xxxGB file, so bitset init should not be the issue, hence I have background stats loop.

I’ll extract parseIpV4 into a microbenchmark, to confirm Op/s.

1 Like

I generated 100MB file and now it seems to be roughly equal

2 Likes

Thanks, that looks fine. I don’t have any explanation for the difference yet then.

Huh. Maybe it’s just my hardware.

On my machine, Go looks faster.

const zbench = @import("zbench");

fn benchParseIpV4(allocator: std.mem.Allocator) void {
    _ = allocator;
    const ip = "97.71.174.4";

    const parsed = parseIpV4(ip);
    std.mem.doNotOptimizeAway(parsed);
}

test "bench ops" {
    var bench = zbench.Benchmark.init(std.testing.allocator, .{
        .max_iterations = std.math.maxInt(u32),
        .time_budget_ns = std.time.ns_per_s, // run for one second
    });
    defer bench.deinit();
    try bench.add("parse ipv4", benchParseIpV4, .{});
    var buf: [1024]u8 = undefined;
    var stderr = std.fs.File.stderr().writer(&buf);
    const writer = &stderr.interface;
    try bench.run(writer);
    try writer.flush();
}
var ip = []byte("97.71.174.4")

func Benchmark(b *testing.B) {
	for b.Loop() {
		mm := main.ParseIPv4(ip)
		if mm == 0 { // use it just to be sure
			b.Log(mm)
		}
	}
}

Results

$ zig build test --release=fast
test
└─ run test stderr
benchmark              runs     total time     time/run (avg ± σ)    (min ... max)                p75        p99        p995
-----------------------------------------------------------------------------------------------------------------------------
parse ipv4             57472018 995.847ms      17ns ± 71ns           (10ns ... 279.503us)         20ns       21ns       21ns

$ go test -bench=. -benchtime=1s ./...
goos: linux
goarch: amd64
pkg: codeberg.org/ip_file_counter
cpu: AMD Ryzen 9 7940HS w/ Radeon 780M Graphics
Benchmark-16            148569764                8.093 ns/op
PASS
ok      codeberg.org/ip_file_counter    1.205s

And 100M file (7.5M lines)

~/tmp/ip_file_counter via 🐹 v1.24.6 via ↯ v0.15.1 took 11s
$ rm -rf zig-out
~/tmp/ip_file_counter via 🐹 v1.24.6 via ↯ v0.15.1
$ zig build --release=fast
~/tmp/ip_file_counter via 🐹 v1.24.6 via ↯ v0.15.1
$ go build -o ip_file_counter .
~/tmp/ip_file_counter via 🐹 v1.24.6 via ↯ v0.15.1
$ poop './zig-out/bin/ip_file_counter set100M' './ip_file_counter set100M'
Benchmark 1 (6 runs): ./zig-out/bin/ip_file_counter set100M
  measurement          mean ± σ            min … max           outliers         delta
  wall_time           975ms ± 7.32ms     967ms …  987ms          0 ( 0%)        0%
  peak_rss            538MB ± 82.9KB     538MB …  538MB          0 ( 0%)        0%
  cpu_cycles         4.04G  ± 14.3M     4.02G  … 4.06G           0 ( 0%)        0%
  instructions       1.43G  ± 52.0      1.43G  … 1.43G           0 ( 0%)        0%
  cache_references   63.5M  ±  131K     63.3M  … 63.7M           0 ( 0%)        0%
  cache_misses       11.4M  ±  108K     11.2M  … 11.5M           0 ( 0%)        0%
  branch_misses      5.49M  ± 12.9K     5.47M  … 5.51M           0 ( 0%)        0%
Benchmark 2 (20 runs): ./ip_file_counter set100M
  measurement          mean ± σ            min … max           outliers         delta
  wall_time           262ms ± 5.28ms     256ms …  274ms          0 ( 0%)        ⚡- 73.1% ±  0.6%
  peak_rss           24.1MB ± 84.0KB    24.0MB … 24.3MB          0 ( 0%)        ⚡- 95.5% ±  0.0%
  cpu_cycles          898M  ± 24.3M      875M  …  956M           0 ( 0%)        ⚡- 77.8% ±  0.5%
  instructions       3.31G  ± 51.6K     3.31G  … 3.31G           0 ( 0%)        💩+131.2% ±  0.0%
  cache_references   18.6M  ± 4.79M     13.3M  … 24.1M           0 ( 0%)        ⚡- 70.8% ±  6.5%
  cache_misses        145K  ± 26.4K      109K  …  175K           0 ( 0%)        ⚡- 98.7% ±  0.5%
  branch_misses      5.65M  ±  353K     5.47M  … 6.61M           3 (15%)          +  2.9% ±  5.5%

Yea really strange maybe its bug in 0.15.1? Im on master version. Also just to be sure i benchmarked with 14GB files.

I think you are not specifying the optimization mode correctly.
When using the build script, -- is used to pass arguments to the executable.
If you want to enamble optimization you should specify -Doptimize=ReleaseFast instead of --release=fast

Edit: well i was wrong see reply

$ zig init
$ zig build --help
Usage: zig build [steps] [options]

...

  --release[=mode]             Request release mode, optionally specifying a
                               preferred optimization mode: fast, safe, small
2 Likes

I just tested here and the zig implementation on my machine is actually faster than the go implementation by a small margin. strace shows that the go implementation does significant more syscalls than the zig one:

❯ strace -fc ./zig-out/bin/zig-ip
opening file small_set
strace: Process 53342 attached
total unique is 789639
% time     seconds  usecs/call     calls    errors syscall
------ ----------- ----------- --------- --------- ----------------
100.00    0.000319          13        24           read
  0.00    0.000000           0         3           close
  0.00    0.000000           0         2           fstat
  0.00    0.000000           0        10           mmap
  0.00    0.000000           0         3           mprotect
  0.00    0.000000           0         1           munmap
  0.00    0.000000           0         3           brk
  0.00    0.000000           0         2           rt_sigaction
  0.00    0.000000           0         4           rt_sigprocmask
  0.00    0.000000           0         2           pread64
  0.00    0.000000           0         2           writev
  0.00    0.000000           0         1         1 access
  0.00    0.000000           0         1           madvise
  0.00    0.000000           0         1           execve
  0.00    0.000000           0         1           arch_prctl
  0.00    0.000000           0         1           gettid
  0.00    0.000000           0         1           set_tid_address
  0.00    0.000000           0         3           openat
  0.00    0.000000           0         2           set_robust_list
  0.00    0.000000           0         2           prlimit64
  0.00    0.000000           0         1           getrandom
  0.00    0.000000           0         2           rseq
  0.00    0.000000           0         1           clone3
------ ----------- ----------- --------- --------- ----------------
100.00    0.000319           4        73         1 total
❯ strace -fc ./go-ip
strace: Process 53475 attached
strace: Process 53476 attached
strace: Process 53477 attached
strace: Process 53478 attached
strace: Process 53479 attached
Unique IP's:  789639
% time     seconds  usecs/call     calls    errors syscall
------ ----------- ----------- --------- --------- ------------------
 52.04    0.038831         491        79         5 futex
 37.54    0.028007         168       166           nanosleep
  5.59    0.004173         521         8           read
  1.35    0.001007          53        19           tgkill
  0.47    0.000351          20        17           rt_sigprocmask
  0.47    0.000349           3       114           rt_sigaction
  0.46    0.000343          68         5           clone
  0.40    0.000299           8        35           mmap
  0.26    0.000191          17        11           gettid
  0.25    0.000190          12        15           prctl
  0.22    0.000164           8        19           getpid
  0.22    0.000163          13        12           sigaltstack
  0.19    0.000145          24         6           sched_yield
  0.19    0.000142           7        19           rt_sigreturn
  0.07    0.000053          26         2           sched_getaffinity
  0.07    0.000050           5        10           fcntl
  0.05    0.000034          17         2           pread64
  0.04    0.000029          14         2           epoll_pwait
  0.03    0.000024          24         1           epoll_create1
  0.02    0.000018           9         2           prlimit64
  0.02    0.000017           5         3           madvise
  0.02    0.000017           8         2         1 epoll_ctl
  0.01    0.000009           1         5           openat
  0.01    0.000005           5         1           eventfd2
  0.00    0.000002           2         1           write
  0.00    0.000002           0         4           close
  0.00    0.000000           0         1           execve
  0.00    0.000000           0         1           arch_prctl
------ ----------- ----------- --------- --------- ------------------
100.00    0.074615         132       562         6 total

I’m wondering if the problem could be some underlying factor in the os, like filesystem.

Also, given your flamegraph shows the function names, I’m assuming you’re not using llvm somehow. When I explicitly disable llvm in my build I see function names in perf’s report and the 4~5x performance difference between golang’s and zig’s implementations.

Actually, if I look at strace result for non-llvm zig, I do get an odd value there which might explain it:

❯ strace -fc ./zig-out/bin/zig-ip-native
opening file small_set
strace: Process 55350 attached
1243375 per second
total unique is 789639
% time     seconds  usecs/call     calls    errors syscall
------ ----------- ----------- --------- --------- ----------------
 93.47    0.029074       29074         1           clock_nanosleep
  4.27    0.001327          53        25           read
  0.82    0.000255         255         1           execve
  0.49    0.000152          10        14           mmap
  0.12    0.000038           9         4           rt_sigprocmask
  0.12    0.000036           9         4           openat
  0.11    0.000034          34         1           clone3
  0.09    0.000028           9         3           mprotect
  0.06    0.000019           4         4           close
  0.06    0.000019           6         3           fstat
  0.05    0.000016           5         3           brk
  0.04    0.000013           6         2           pread64
  0.04    0.000012           6         2           set_robust_list
  0.04    0.000012           6         2           rseq
  0.04    0.000011          11         1           munmap
  0.03    0.000009           3         3           writev
  0.03    0.000008           4         2           rt_sigaction
  0.03    0.000008           8         1         1 access
  0.03    0.000008           4         2           prlimit64
  0.02    0.000007           7         1           madvise
  0.02    0.000005           5         1           arch_prctl
  0.02    0.000005           2         2           gettid
  0.02    0.000005           5         1           getrandom
  0.01    0.000004           4         1           set_tid_address
------ ----------- ----------- --------- --------- ----------------
100.00    0.031105         370        84         1 total

Somehow the native version is yielding this extra clock_nanosleep which seems to be tanking the performance of this tool.

1 Like

Here’s log from another machine, intel laptop on ext4.

ip-parsing-repro via 🐹 v1.25.0 via ↯ v0.15.1 took 10s
$ rm -rf ~/.cache/zig/
ip-parsing-repro via 🐹 v1.25.0 via ↯ v0.15.1
$ rm -rf .zig-cache/ zig-out/
ip-parsing-repro via 🐹 v1.25.0 via ↯ v0.15.1
$ ~/zig-x86_64-linux-0.16.0-dev.254+6dd0270a1/zig build --release=fast
ip-parsing-repro via 🐹 v1.25.0 via ↯ v0.15.1 took 7s
$ go build .
ip-parsing-repro via 🐹 v1.25.0 via ↯ v0.15.1
$ sudo (which poop) './ip_file_counter ./ips_100mb.txt' './zig-out/bin/ip_file_counter ./ips_100mb.txt'
Benchmark 1 (16 runs): ./ip_file_counter ./ips_100mb.txt
  measurement          mean ± σ            min … max           outliers         delta
  wall_time           319ms ± 3.54ms     315ms …  328ms          1 ( 6%)        0%
  peak_rss           24.0MB ±  130KB    23.8MB … 24.2MB          0 ( 0%)        0%
  cpu_cycles          957M  ± 3.20M      946M  …  960M           1 ( 6%)        0%
  instructions       3.38G  ± 9.32M     3.35G  … 3.39G           1 ( 6%)        0%
  cache_references   1.85M  ± 14.9K     1.82M  … 1.88M           0 ( 0%)        0%
  cache_misses        411K  ± 22.4K      380K  …  478K           1 ( 6%)        0%
  branch_misses      5.78M  ± 30.6K     5.66M  … 5.79M           2 (13%)        0%
Benchmark 2 (5 runs): ./zig-out/bin/ip_file_counter ./ips_100mb.txt
  measurement          mean ± σ            min … max           outliers         delta
  wall_time          1.23s  ± 5.03ms    1.22s  … 1.23s           0 ( 0%)        💩+284.1% ±  1.3%
  peak_rss            538MB ± 89.7KB     538MB …  538MB          0 ( 0%)        💩+2143.6% ±  0.5%
  cpu_cycles         3.27G  ± 12.9M     3.26G  … 3.30G           0 ( 0%)        💩+242.1% ±  0.7%
  instructions       1.63G  ± 1.22M     1.63G  … 1.63G           1 (20%)        ⚡- 51.8% ±  0.3%
  cache_references   35.4M  ±  377K     34.8M  … 35.7M           0 ( 0%)        💩+1814.4% ± 10.1%
  cache_misses       24.8M  ± 99.8K     24.7M  … 24.9M           0 ( 0%)        💩+5928.1% ± 13.0%
  branch_misses      5.64M  ± 4.35K     5.64M  … 5.65M           0 ( 0%)        ⚡-  2.3% ±  0.5%
ip-parsing-repro via 🐹 v1.25.0 via ↯ v0.15.1 took 11s
$


ip-parsing-repro via 🐹 v1.25.0 via ↯ v0.15.1 took 19s
$ rm -rf .zig-cache/ zig-out/ ~/.cache/zig/
ip-parsing-repro via 🐹 v1.25.0 via ↯ v0.15.1
$ ~/zig-x86_64-linux-0.16.0-dev.254+6dd0270a1/zig build test --release=fast
test
└─ run test stderr
benchmark              runs     total time     time/run (avg ± σ)    (min ... max)                p75        p99        p995
-----------------------------------------------------------------------------------------------------------------------------
parse ipv4             67354362 1.01s          14ns ± 16ns           (13ns ... 78.459us)          15ns       16ns       17ns
ip-parsing-repro via 🐹 v1.25.0 via ↯ v0.15.1
$ go test -bench=. -benchtime=1s ./...
goos: linux
goarch: amd64
pkg: codeberg.org/ip_file_counter
cpu: 13th Gen Intel(R) Core(TM) i7-13700H
Benchmark-20            85022845                13.42 ns/op
PASS
ok      codeberg.org/ip_file_counter    1.146s
ip-parsing-repro via 🐹 v1.25.0 via ↯ v0.15.1
$

Benchmarks look more sane, but reading large file doesn’t :frowning:

And pushed the source code in one place knightpp/ip-parsing-repro - Codeberg.org with that 100MB file.

Could you try forcing llvm on & off explicitly and comparing the result?

 const exe = b.addExecutable(.{
        .name = "ip_file_counter",
        .root_module = b.createModule(.{
            .root_source_file = b.path("src/main.zig"),
            .target = target,
            .optimize = optimize,
            .strip = false,
        }),
       .use_llvm = true, // and then false
    });

Also, I’m curious as to what strace -fc would output

1 Like

I’m still on intel laptop

llvm=true vs llvm=false

ip-parsing-repro via 🐹 v1.25.0 via ↯ v0.15.1
$ sudo (which poop) './zig+llvm=true ./ips_100mb.txt' './zig+llvm=false ./ips_100mb.txt'
Benchmark 1 (5 runs): ./zig+llvm=true ./ips_100mb.txt
  measurement          mean ± σ            min … max           outliers         delta
  wall_time          1.24s  ± 33.0ms    1.21s  … 1.30s           0 ( 0%)        0%
  peak_rss            538MB ± 89.7KB     538MB …  538MB          0 ( 0%)        0%
  cpu_cycles         3.23G  ± 36.6M     3.17G  … 3.27G           1 (20%)        0%
  instructions       1.63G  ± 5.51M     1.62G  … 1.63G           1 (20%)        0%
  cache_references   30.3M  ± 1.69M     27.8M  … 32.4M           0 ( 0%)        0%
  cache_misses       21.3M  ± 1.14M     19.6M  … 22.6M           0 ( 0%)        0%
  branch_misses      5.64M  ± 19.3K     5.60M  … 5.65M           1 (20%)        0%
Benchmark 2 (3 runs): ./zig+llvm=false ./ips_100mb.txt
  measurement          mean ± σ            min … max           outliers         delta
  wall_time          4.44s  ± 5.14ms    4.43s  … 4.44s           0 ( 0%)        💩+257.9% ±  3.9%
  peak_rss            538MB ± 94.6KB     538MB …  538MB          0 ( 0%)          +  0.0% ±  0.0%
  cpu_cycles         16.2G  ± 10.4M     16.2G  … 16.2G           0 ( 0%)        💩+401.6% ±  1.7%
  instructions       18.0G  ± 11.2M     18.0G  … 18.0G           0 ( 0%)        💩+1003.0% ±  0.9%
  cache_references   32.1M  ±  476K     31.8M  … 32.7M           0 ( 0%)          +  6.2% ±  8.3%
  cache_misses       20.6M  ±  417K     20.1M  … 20.9M           0 ( 0%)          -  3.3% ±  8.1%
  branch_misses      24.1M  ±  113K     24.0M  … 24.2M           0 ( 0%)        💩+327.0% ±  2.1%

And straces

$ strace -fc ./zig+llvm=true ./ips_100mb.txt
opening file ./ips_100mb.txt
strace: Process 207165 attached
5833265 per second
total unique is 7416590
% time     seconds  usecs/call     calls    errors syscall
------ ----------- ----------- --------- --------- ----------------
 97,17    0,143376      143376         1           clock_nanosleep
  2,36    0,003475          34       102           read
  0,36    0,000527         527         1           execve
  0,04    0,000061          61         1           clone
  0,02    0,000034          34         1           openat
  0,02    0,000028          14         2           mmap
  0,01    0,000014           4         3           writev
  0,01    0,000013          13         1           mprotect
  0,00    0,000006           6         1           arch_prctl
  0,00    0,000005           5         1           rt_sigaction
  0,00    0,000005           2         2           gettid
  0,00    0,000005           5         1           prlimit64
  0,00    0,000000           0         1           close
------ ----------- ----------- --------- --------- ----------------
100,00    0,147549        1250       118           total

$ strace -fc ./zig+llvm=false ./ips_100mb.txt
opening file ./ips_100mb.txt
strace: Process 207002 attached
1293233 per second
1816523 per second
1810796 per second
1822680 per second
total unique is 7416590
% time     seconds  usecs/call     calls    errors syscall
------ ----------- ----------- --------- --------- ----------------
 98,23    0,145138       36284         4           clock_nanosleep
  1,34    0,001978          19       102           read
  0,28    0,000421         421         1           execve
  0,04    0,000058          58         1           clone
  0,04    0,000054          27         2           mmap
  0,03    0,000040          40         1           openat
  0,01    0,000021           3         6           writev
  0,01    0,000015          15         1           mprotect
  0,01    0,000009           9         1           prlimit64
  0,00    0,000006           6         1           rt_sigaction
  0,00    0,000006           6         1           arch_prctl
  0,00    0,000006           3         2           gettid
  0,00    0,000000           0         1           close
------ ----------- ----------- --------- --------- ----------------
100,00    0,147752        1191       124           total
1 Like

reply to opening post:
How does the performance between Zig and Go compare if you remove the printStatsLoop+thread in both programs?

I think it would be interesting to know whether that simpler version of the program gives a similar difference in the results.

It did not change anything

poop output

Note, this on AMD CPU.

λ poop './zig-out/bin/ip_file_counter ips_100mb.txt' './ip_file_counter ips_100mb.txt'
Benchmark 1 (6 runs): ./zig-out/bin/ip_file_counter ips_100mb.txt
  measurement          mean ± σ            min … max           outliers         delta
  wall_time           988ms ± 29.8ms     965ms … 1.04s           0 ( 0%)        0%
  peak_rss            538MB ± 98.7KB     538MB …  538MB          0 ( 0%)        0%
  cpu_cycles         4.01G  ± 36.9M     3.98G  … 4.07G           0 ( 0%)        0%
  instructions       1.43G  ±  138      1.43G  … 1.43G           0 ( 0%)        0%
  cache_references   62.8M  ±  353K     62.5M  … 63.5M           0 ( 0%)        0%
  cache_misses       11.7M  ±  190K     11.4M  … 11.9M           0 ( 0%)        0%
  branch_misses      5.49M  ± 11.5K     5.48M  … 5.50M           0 ( 0%)        0%
Benchmark 2 (20 runs): ./ip_file_counter ips_100mb.txt
  measurement          mean ± σ            min … max           outliers         delta
  wall_time           253ms ± 3.60ms     249ms …  263ms          0 ( 0%)        ⚡- 74.4% ±  1.4%
  peak_rss           24.0MB ±  145KB    23.7MB … 24.3MB          0 ( 0%)        ⚡- 95.5% ±  0.0%
  cpu_cycles          827M  ± 3.13M      822M  …  833M           0 ( 0%)        ⚡- 79.4% ±  0.4%
  instructions       3.35G  ± 68.5K     3.35G  … 3.35G           1 ( 5%)        💩+135.1% ±  0.0%
  cache_references   13.4M  ± 58.4K     13.3M  … 13.5M           0 ( 0%)        ⚡- 78.7% ±  0.3%
  cache_misses        121K  ± 5.81K      110K  …  132K           0 ( 0%)        ⚡- 99.0% ±  0.7%
  branch_misses      5.62M  ± 64.0K     5.52M  … 5.71M           0 ( 0%)        💩+  2.3% ±  1.0%

I tested a bit more and noticed that, for me, the hotspot is on set.set(num). By commenting that out and capturing num so the compiler doesn’t oprimize away the loop, there’s a significant improvement in performance for 100+mb. I’m saying that because your comment suggests the hotspot is in parseIpV4, so maybe you’d want to test that to isolate further where the bottleneck might be.

4 Likes

Good catch.

I want to point out that DynamicBitSet is not being used to advantage here. As the docs state:

DynamicBitSet: A bit set with runtime-known size, backed by an allocated slice of usize.

std.math.maxInt(u32) is a statically-known size, so the code is paying for something it’s not actually using.

Worth switching to ArrayBitSet:

ArrayBitSet: A bit set with static size, which is backed by an array of usize. This set is good for sets with a larger size, but may use more bytes than necessary if your set is small.

And seeing if that helps matters.

1 Like

Worth switching to ArrayBitSet:

I used it initially but it fails with

fish: Job 1, './zig-out/bin/ip_file_counter' terminated by signal SIGSEGV (Address boundary error)

I guess stack (or wherever it ends up) is not big enough. Fun fact, the executable is 1.8 GB in this case.