I really like nnd.
It’s fast, it supports watchers, registers etc… It shows both source code and assembly at the same time.
It also easy to use. In my programs i put a @breakpoint() and then just nnd your_program your arguments.
I was a heavy user of “Debugger as a REPL with context” when I was writing Kotlin/Java 10 years ago:
I mostly avoided debuggers since, as I switched to native languages, and debuggers for native languages are abysmal.
I do occasionally still reach for a debugger when something goes really wrong (“I am in a signal handler, but where’s my stack?” kind of wrong), and its been a uniformly mixed experience — half of the time debugger itself crashes on you, and the other half it prints random garbage, and anything more complicated than “what’s the contents of this register/memory” is untrustworthy.
I’m mainly using gdb by hand, aka. running gdb zig-out/bin/program. I’ve recently added nvim-dap (like a plugin to your editor you can think) to my nvim workflow to have integrations in my editor. DAP is a protocol for an editor / client to communicate with the debugger.
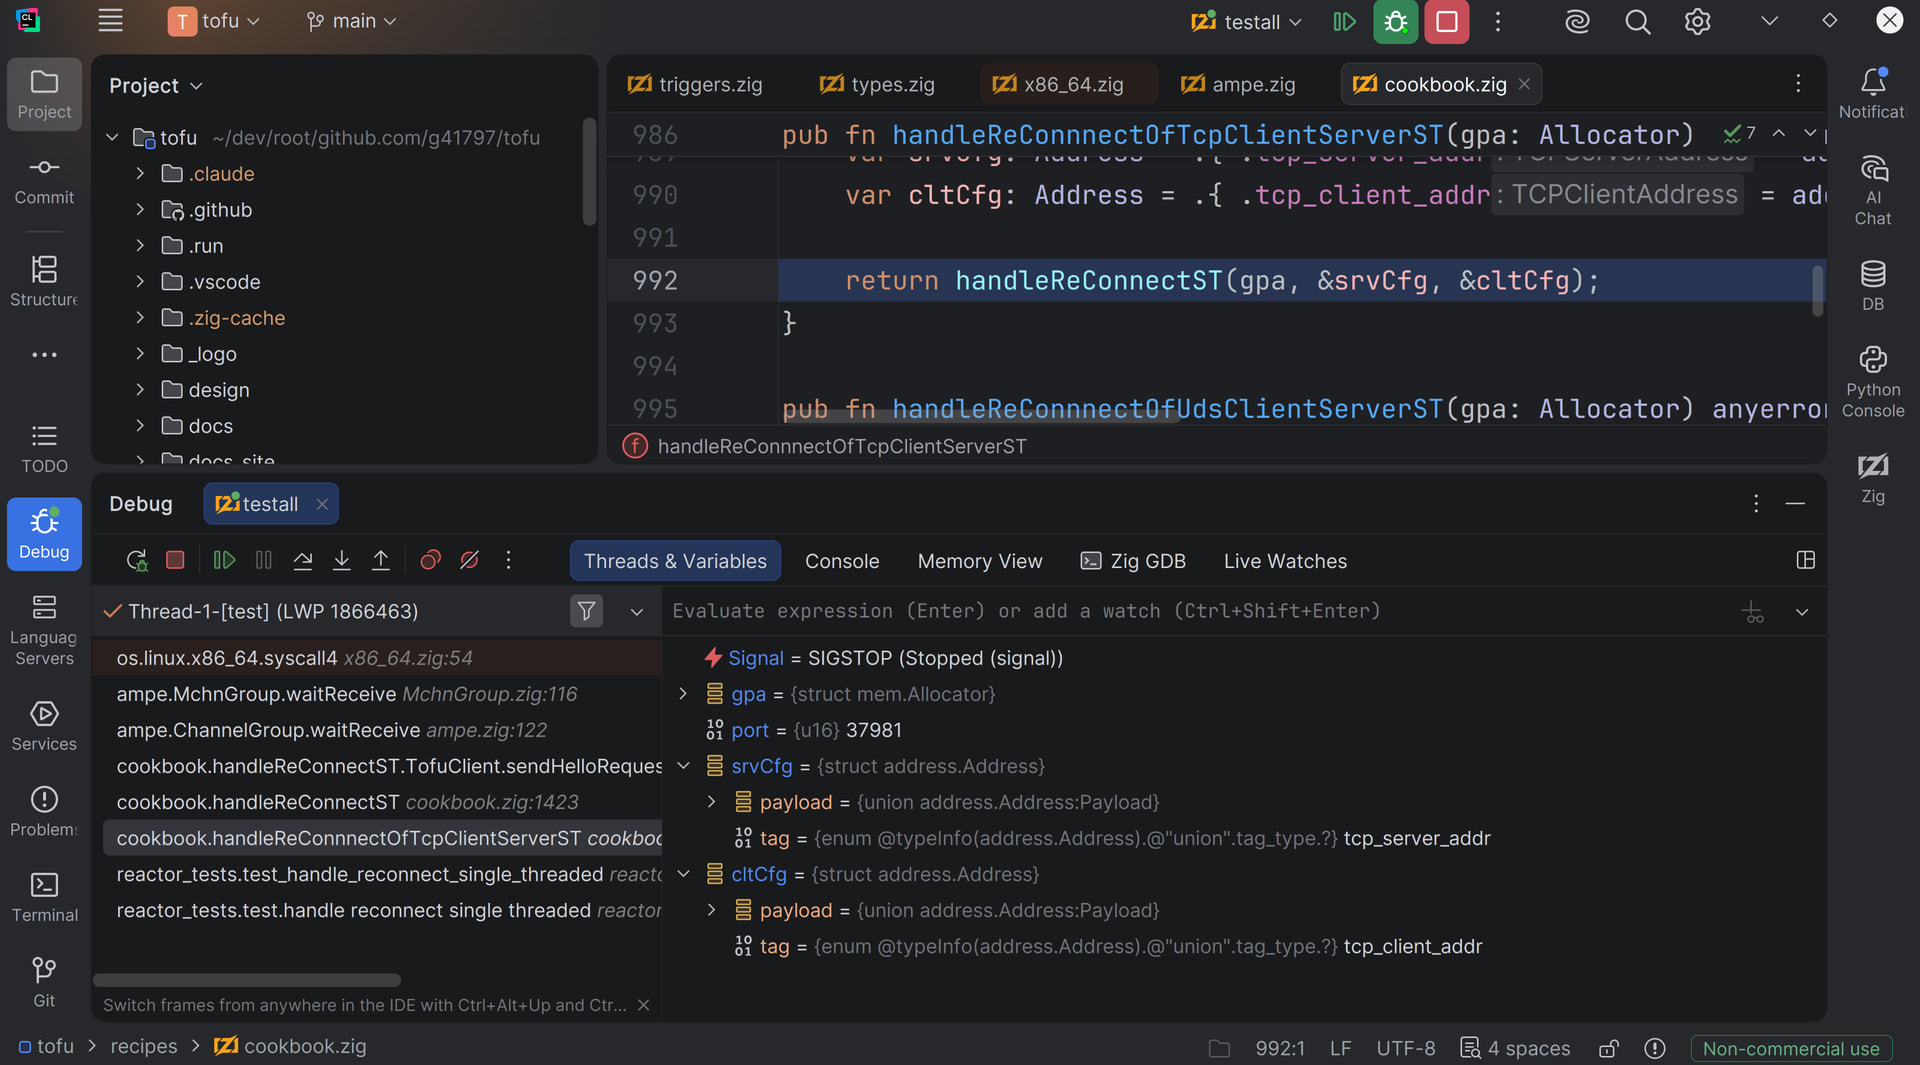
In your debugger it is easier to see, step by step, what is your program doing. It avoids to add multiple print statement and recompile each time. You have also the ability to modify values on the fly, add breakpoints if and only if a values has changed to something, etc. It is a very powerful tool.
Debug info is information attached to a binary that helps the debugger know what bytes in the compiled code correspond to what code in text in your files
There are a lot of standalone debugging tools, most of them I would say are standalone. For zig / c / c++ / rust you might consider lldb (llvm’s debugger, preferred) or gdb (I chose it just because I have familiarity with it)
I don’t know ? I’m not really sure what you refer by that
I would advise lldb, don’t forget that you need to compile the binary using llvm (change your build.zig) to see correct information
I’m not aware of new and upcoming debuggers, but others will know more about that subject than me
Not very “general purpose”, but when I’m doing embedded Zig on an stm32 I use the Stm32CubeProgrammer debugger window to get some clues as to what’s gone horribly wrong. It typically will give a code for what has caused a hard fault if one has gone off, as well as the instruction address that may have lead to the fault.
It also gives register values which has made it nice to see when a sentinel value is showing up, yet again cluing me in to what has gone horribly wrong.
With all due respect to those who like to debug Zig, it’s just a nightmare. My only experience with Zig debugging was based on the invisibility of variables after exiting the main function and entering another one. Therefore, I gave up on these futile attempts to debug. I hope that this will be fixed someday.