Hi,
This is my first post.
I recently came across the Zig programming language, and since I’m about to start the implementation phase of a large project (https://github.com/iz0eyj/LSSA ), I’m seriously considering taking this opportunity to learn Zig along the way, instead of using my usual combination of C# and C.
What’s holding me back are some issues with my development environment, which must be based on JetBrains products on Windows.
Unfortunately, although the Zig plugin seems to have been abandoned for several years now, editing works fine, but I can’t get the debugger to run.
After many attempts, I managed to get LLDB working from the command line, but I haven’t succeeded in integrating it into my project — neither in CLion nor in IntelliJ.
It goes without saying that working without a debugger inside the IDE would make managing a project of this size practically impossible. Therefore, I’d like to know whether a solution exists.
Do the JetBrains IDEs not have some generic UI frontend for LLDB or GDB? E.g. in VSCode the CodeLLDB extension can be used to debug all sorts of languages that emit DWARF debug info, and that’s what I use for debugging Zig code.
Alternatively, AFAIK the Zig msvc targets emit .pdb debug information which should work with a vanilla Windows debugger frontend.
E.g. TL;DR: just for debugging a Zig executable with DWARF or PDB debug info, you shouldn’t need special Zig support in an IDE.
@ForeverZer0
Perfect, thank you.
I don’t know why it didn’t show me this plugin but a “Zig Support” abandoned for three years.
Now the problem is integrating the debugger… the documentation says that on Windows it should be able to use the one from Vsual Studio, which in all the group’s machines is available as Professional 2022… I’ll mess around a bit.
Thanks again.
@g41797
No, no Linux, there would be problems much bigger than the Zig debugger.
You could use WSL 2, but I would prefer to avoid it.
@floooh
Yes they do.
The topic arises from the fact that these IDEs are designed for Cmake projects, but now that I have found this plugin not “dead” I will certainly be able to do the integration… or we will decide to use Visual Studio Pro, losing full integration with the IA.
VS Code is not an option, all our projects are on VS Pro, Embarcadero and Jetbrans.
We tried to do something with the forks of VS Code (Wndsurf) but we immediately abandoned the idea because more than IDEs they are text editors that pretend to be IDEs.
In the end I adopted a slightly uncomfortable but very pragmatic solution: I created the project in VS Pro and opened its folder in Clion.
This way I have all the power of VS Pro for debugging and profiling, combined with the convenience of fully AI-assisted editing offered by Clion.
It is not that inconvenient because the changes to the files are immediately replicated in the Visual Studio editor without the need to reload.
Code LLMs are typically not very helpful with Zig, so you may want to temper your expectations. The language is still young and experiencing frequent changes, so things that AI has trained on that may have worked in the past no longer do.
I would strongly suggest you not rely upon AI at all for learning any language, but this is doubly true with Zig. Code LLMs may be able to function as halfway decent assistants for development, but are absolutely terrible teachers at it, which you won’t even be able to determine yourself without the prerequisite knowledge of the language you are using.
I generally don’t ask AIs to write critical code sections for me—if after forty years of experience I still needed others (AI or human) to do my heavy lifting, I’d be deeply unsatisfied with myself.
However, in a project that’ll likely hit a million lines of code, an AI for reviewing is incredibly useful.
More importantly, I’m used to working alongside advanced AIs during:
Solution analysis
Implementation scenario simulations
If a problem admits multiple strategic approaches, nothing beats a sophisticated AI for simulating real-world scenarios to identify the optimal path.
And then there’s analysis: What we’re doing with LSSA is entirely novel—uncharted territory. Only an AI can realistically assess:
‘Yes, I’d happily live in this house.’
‘Nice, but I’d move that table slightly to the right
@stano
but look, in the end I like the solution I found with Clion and VS Pro open at the same time on the same project so much that I think I’ll make it a habit.
I usually work on two monitors, so having two separate IDEs is not very relevant, the important thing is that both update the editor content in real time when the file is modified, and they do.
So using this technique you get the best of both environments.
Apologies for rezzing this thread, but is this the first Zig discord link on the communities page (as of writing)?
I’m trying to use FalsePattern’s extension. I have almost no clue about what I should expect while debugging on Windows, but if it’s .pdb files, those are indeed what accompany other build artefacts when I use zig build.
I just want to figure out how to have the Editor (+ MSVC tooling) correctly use the debug info.
I understood from your build.zig that you have created a separate module containing all your tests, which isn’t what I have in my project. I anticipate my project is small enough to allow small unit tests to just be appended right after the logic.
Your pattern would work in my case, but that would be obvious since none of your tests depend on each other, whereas my files containing in-module tests must obviously depend on each other. Hence my concern.
As for having Windows instead of Fedora, I’d imagine I can still run LLVM/LLD tests with your flags, since Zig hasn’t dropped pre-shipped LLVM yet (as of writing, I know they plan to change that with the 1.0.0 milestone). However, build test was working perfectly up until I ran into a debugging issue with MSVC.
Morevover, even with single file tests, I can’t step through code.
I went looking for other threads. Everyone says that I need the Zig LLDB to even attempt to debug it due to how non-standard it is (heavily paraphrasing this). Is there a way to just run the debugger outside CLion then?
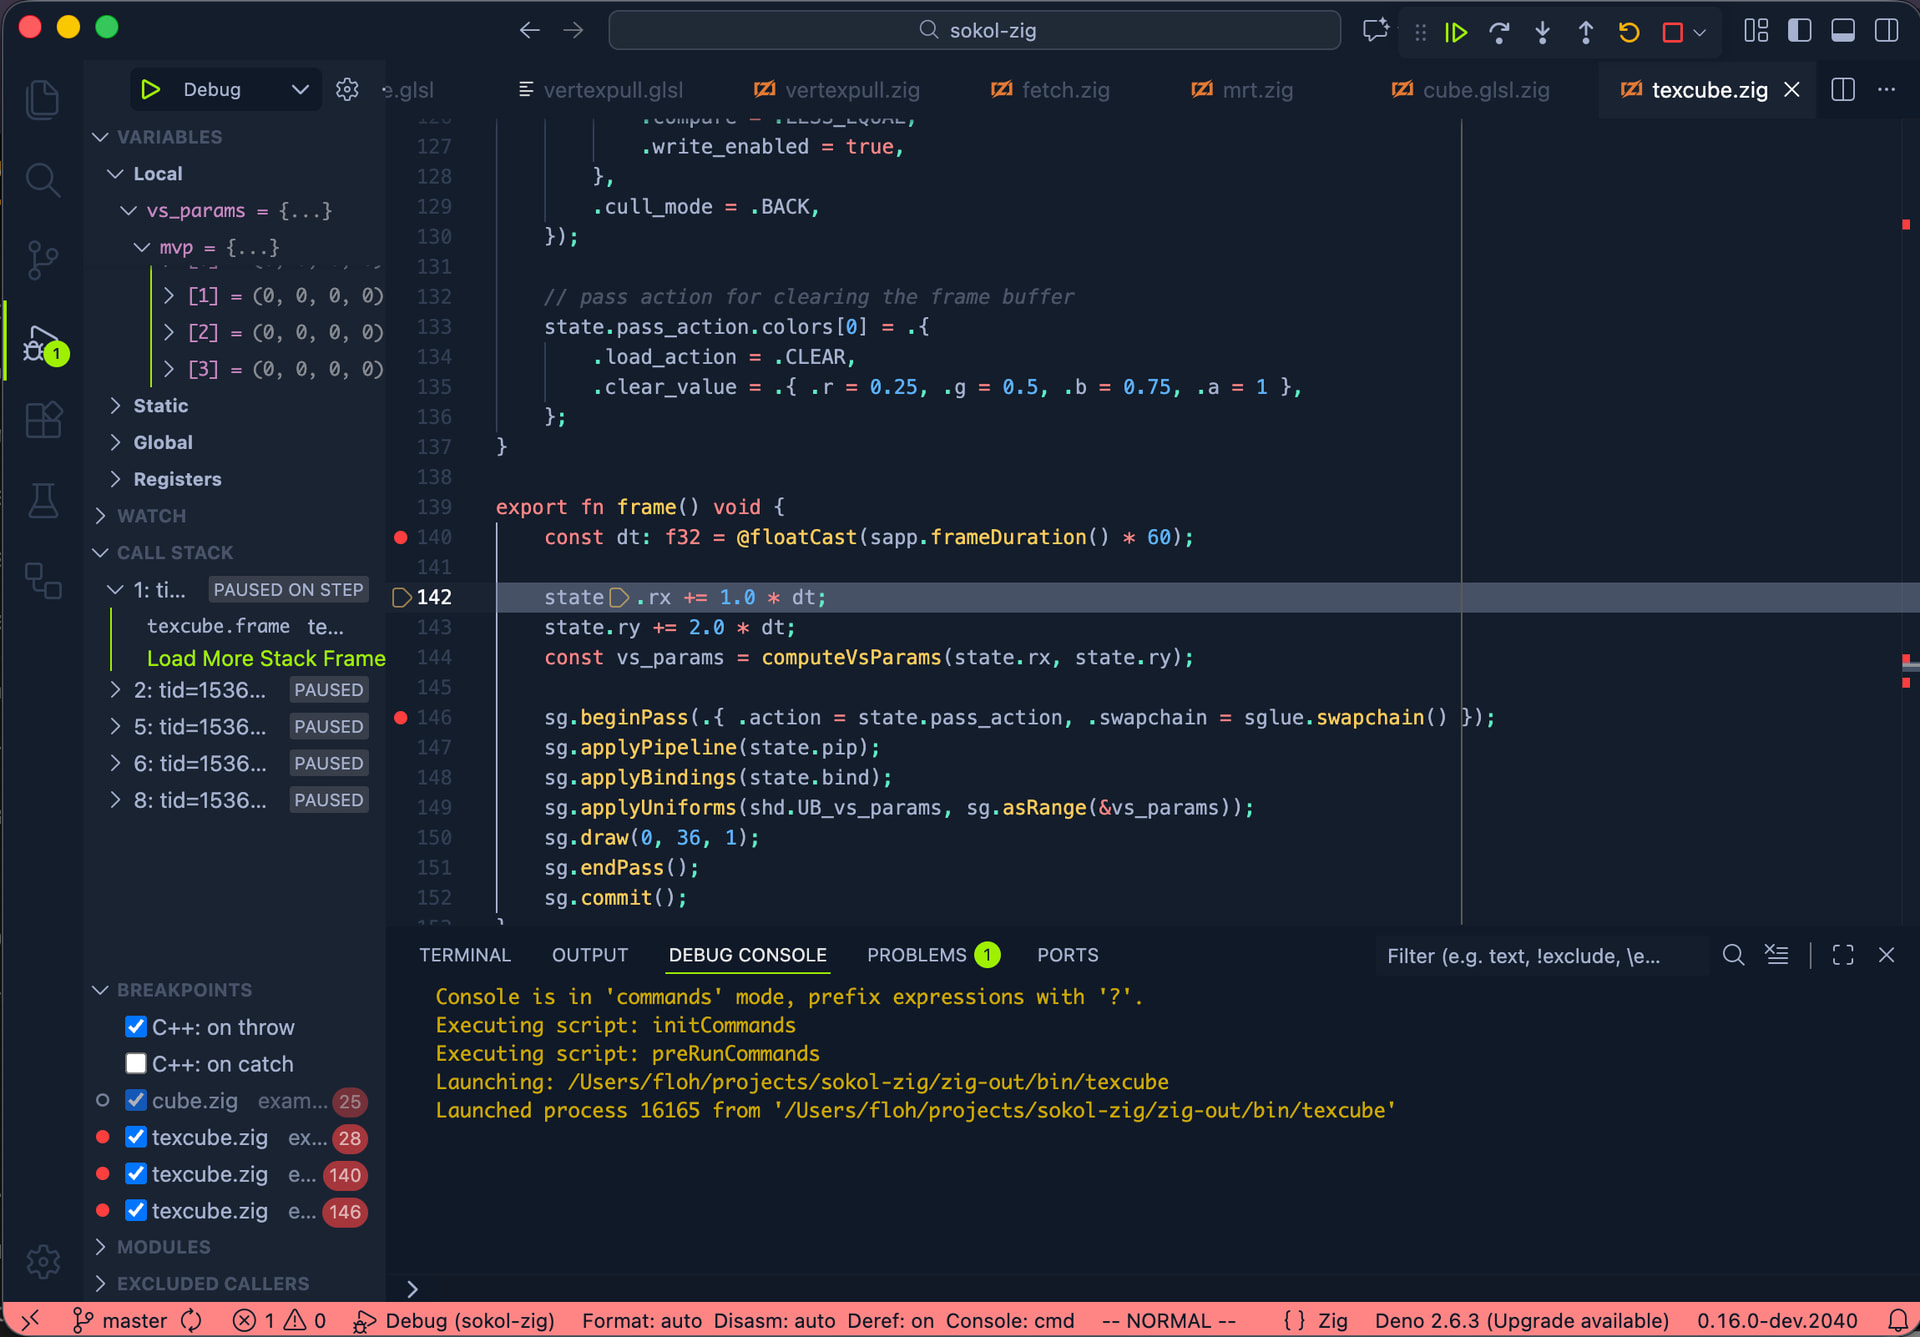
You don’t need a custom LLDB for debugging Zig code, for instance here is me debugging a sokol-zig example in VSCode with the regular CodeLLDB extension (which is just a debug adapter for LLDB):
…I expect that cmdline lldb works just as well. AFAIK the whole “you need a custom LLDB fork to debug Zig code” is about debug-support for comptime code.