I’d like to provide some performance data points in the release notes for the upcoming 0.11.x release. Does anyone have a medium-to-large sized project that has a branch that compiles with zig 0.10.x and a branch that compiles with zig 0.11.x so we can see the difference?
Note that simply checking out an old version of your project won’t be very interesting, because it means all the modifications made since then will make the comparison unfair.
I’d also like to know about peak memory usage.
4 Likes
Do you have a preferred way that people time their compilations? Are you looking for statistics provided directly by the compiler or some sort of outside source? I think it may be helpful to give us a standard way of doing this so we can provide good data points.
1 Like
cgbur
July 25, 2023, 2:14pm
3
2 Likes
xbx
July 26, 2023, 12:14pm
4
dug out my advent of code repo (GitHub - xxxbxxx/advent-of-code: https://adventofcode.com/ solutions in zig )
Benchmark 1 (5 runs): /bin/sh ./alldays.10_1_stage1.sh
  measurement          mean ± σ            min … max           outliers         delta
  wall_time          9.22s  ± 66.6ms    9.16s  … 9.32s           0 ( 0%)        0%
  peak_rss            977MB ± 8.03MB     971MB …  988MB          0 ( 0%)        0%
  cpu_cycles         30.8G  ± 76.8M     30.7G  … 30.9G           0 ( 0%)        0%
  instructions       42.6G  ± 6.16M     42.6G  … 42.6G           0 ( 0%)        0%
  cache_references   1.57G  ± 16.5M     1.55G  … 1.59G           0 ( 0%)        0%
  cache_misses        122M  ±  787K      121M  …  123M           0 ( 0%)        0%
  branch_misses       203M  ±  497K      202M  …  203M           1 (20%)        0%
Benchmark 2 (6 runs): /bin/sh ./alldays.9_1.sh
  measurement          mean ± σ            min … max           outliers         delta
  wall_time          7.75s  ± 9.27ms    7.74s  … 7.77s           0 ( 0%)        ⚡- 15.9% ±  0.7%
  peak_rss            933MB ±  102KB     933MB …  933MB          0 ( 0%)        ⚡-  4.5% ±  0.8%
  cpu_cycles         25.3G  ± 47.6M     25.3G  … 25.4G           0 ( 0%)        ⚡- 17.8% ±  0.3%
  instructions       36.5G  ± 6.47M     36.4G  … 36.5G           0 ( 0%)        ⚡- 14.5% ±  0.0%
  cache_references   1.11G  ± 3.44M     1.10G  … 1.11G           0 ( 0%)        ⚡- 29.5% ±  1.0%
  cache_misses        105M  ±  469K      105M  …  106M           0 ( 0%)        ⚡- 13.9% ±  0.7%
  branch_misses       159M  ±  544K      158M  …  160M           0 ( 0%)        ⚡- 21.9% ±  0.4%
Benchmark 3 (7 runs): /bin/sh ./alldays.10_1_stage2.sh (genrated exe non functional)
  measurement          mean ± σ            min … max           outliers         delta
  wall_time          7.28s  ± 46.4ms    7.24s  … 7.38s           0 ( 0%)        ⚡- 21.0% ±  0.8%
  peak_rss            288MB ± 6.34MB     284MB …  301MB          0 ( 0%)        ⚡- 70.5% ±  0.9%
  cpu_cycles         26.2G  ± 56.0M     26.2G  … 26.3G           0 ( 0%)        ⚡- 14.9% ±  0.3%
  instructions       32.8G  ± 4.32M     32.8G  … 32.9G           0 ( 0%)        ⚡- 22.9% ±  0.0%
  cache_references   1.52G  ± 10.8M     1.50G  … 1.53G           0 ( 0%)        ⚡-  3.3% ±  1.1%
  cache_misses       98.7M  ±  705K     97.7M  … 99.7M           0 ( 0%)        ⚡- 19.3% ±  0.8%
  branch_misses       208M  ±  262K      208M  …  208M           0 ( 0%)        💩+  2.4% ±  0.2%
Benchmark 4 (6 runs): /bin/sh ./alldays.11_0.sh
  measurement          mean ± σ            min … max           outliers         delta
  wall_time          7.74s  ± 29.0ms    7.71s  … 7.79s           0 ( 0%)        ⚡- 16.0% ±  0.7%
  peak_rss            313MB ± 2.48MB     312MB …  318MB          0 ( 0%)        ⚡- 67.9% ±  0.8%
  cpu_cycles         28.3G  ± 30.9M     28.3G  … 28.4G           0 ( 0%)        ⚡-  8.2% ±  0.2%
  instructions       36.3G  ± 4.89M     36.3G  … 36.3G           0 ( 0%)        ⚡- 14.9% ±  0.0%
  cache_references   1.57G  ± 9.90M     1.55G  … 1.58G           0 ( 0%)          +  0.2% ±  1.2%
  cache_misses        121M  ±  608K      121M  …  122M           0 ( 0%)          -  0.9% ±  0.8%
  branch_misses       202M  ±  226K      202M  …  203M           0 ( 0%)          -  0.3% ±  0.3%
using zig builds from Download ⚡ Zig Programming Language
$ cat alldays.9_1.sh
cd aoc.9
rm -r zig-cache zig-out */zig-cache
zig-linux-x86_64-0.9.1/zig build-exe 2019/alldays.zig  --pkg-begin "tools" "common/tools.zig" --pkg-end
zig-linux-x86_64-0.9.1/zig build-exe 2020/alldays.zig  --pkg-begin "tools" "common/tools.zig" --pkg-end
zig-linux-x86_64-0.9.1/zig build-exe 2021/alldays.zig  --pkg-begin "tools" "common/tools_v2.zig" --pkg-end

$ cat alldays.10_1_stage1.sh
cd aoc.10
rm -r zig-cache zig-out */zig-cache
zig-linux-x86_64-0.10.1/zig build-exe -fstage1 2019/alldays.zig  --pkg-begin "tools" "common/tools.zig" --pkg-end
zig-linux-x86_64-0.10.1/zig build-exe -fstage1 2020/alldays.zig  --pkg-begin "tools" "common/tools.zig" --pkg-end
zig-linux-x86_64-0.10.1/zig build-exe -fstage1 2021/alldays.zig  --pkg-begin "tools" "common/tools_v2.zig" --pkg-end

$ cat alldays.11_0.sh
cd aoc.11
rm -r zig-cache zig-out */zig-cache
zig-linux-x86_64-0.11.0-dev.4238+abd960873/zig build-exe 2019/alldays.zig  --mod "tools"::"common/tools.zig" --deps tools
zig-linux-x86_64-0.11.0-dev.4238+abd960873/zig build-exe 2020/alldays.zig  --mod "tools"::"common/tools.zig" --deps tools
zig-linux-x86_64-0.11.0-dev.4238+abd960873/zig build-exe 2021/alldays.zig  --mod "tools"::"common/tools_v2.zig" --deps tools
2 Likes
Edited the code blocks to add sh as the language for highlighting.
2 Likes
No rigorous measurement, but at TigerBeetle it feels like 0.11 is substantially (1.5x–2x) slower than 0.10 for us. Haven’t dug into that yet.
1 Like
That’s really unfortunate. I’ll be keeping an eye on the situation. Any insights you dig up would be greatly appreciated.
For what it’s worth, here is the performance roadmap:
Ditch LLVM for debug builds
Incremental compilation, including serialization of compiler state
compiler perf: eliminate call graph cycle of codegen backends calling into Sema · Issue #15899 · ziglang/zig · GitHub and followup changesRun linker/codegen on a different thread
Introduce a thread pool to semantic analysis
There has been a lot of effort going into (1) and (2) lately. Both of those are big sub-projects. recent progress
5 Likes
Did a tiny bit of looking into this. In particular, here are the repro commits:
That’s manual compilation through build-exe, to eliminate build.zig changes as the probable cause.
What would be the next step for profiling this? I tried perf, but there are no symbols.
EDIT: FWIW, master behaves like 0.11
3 Likes
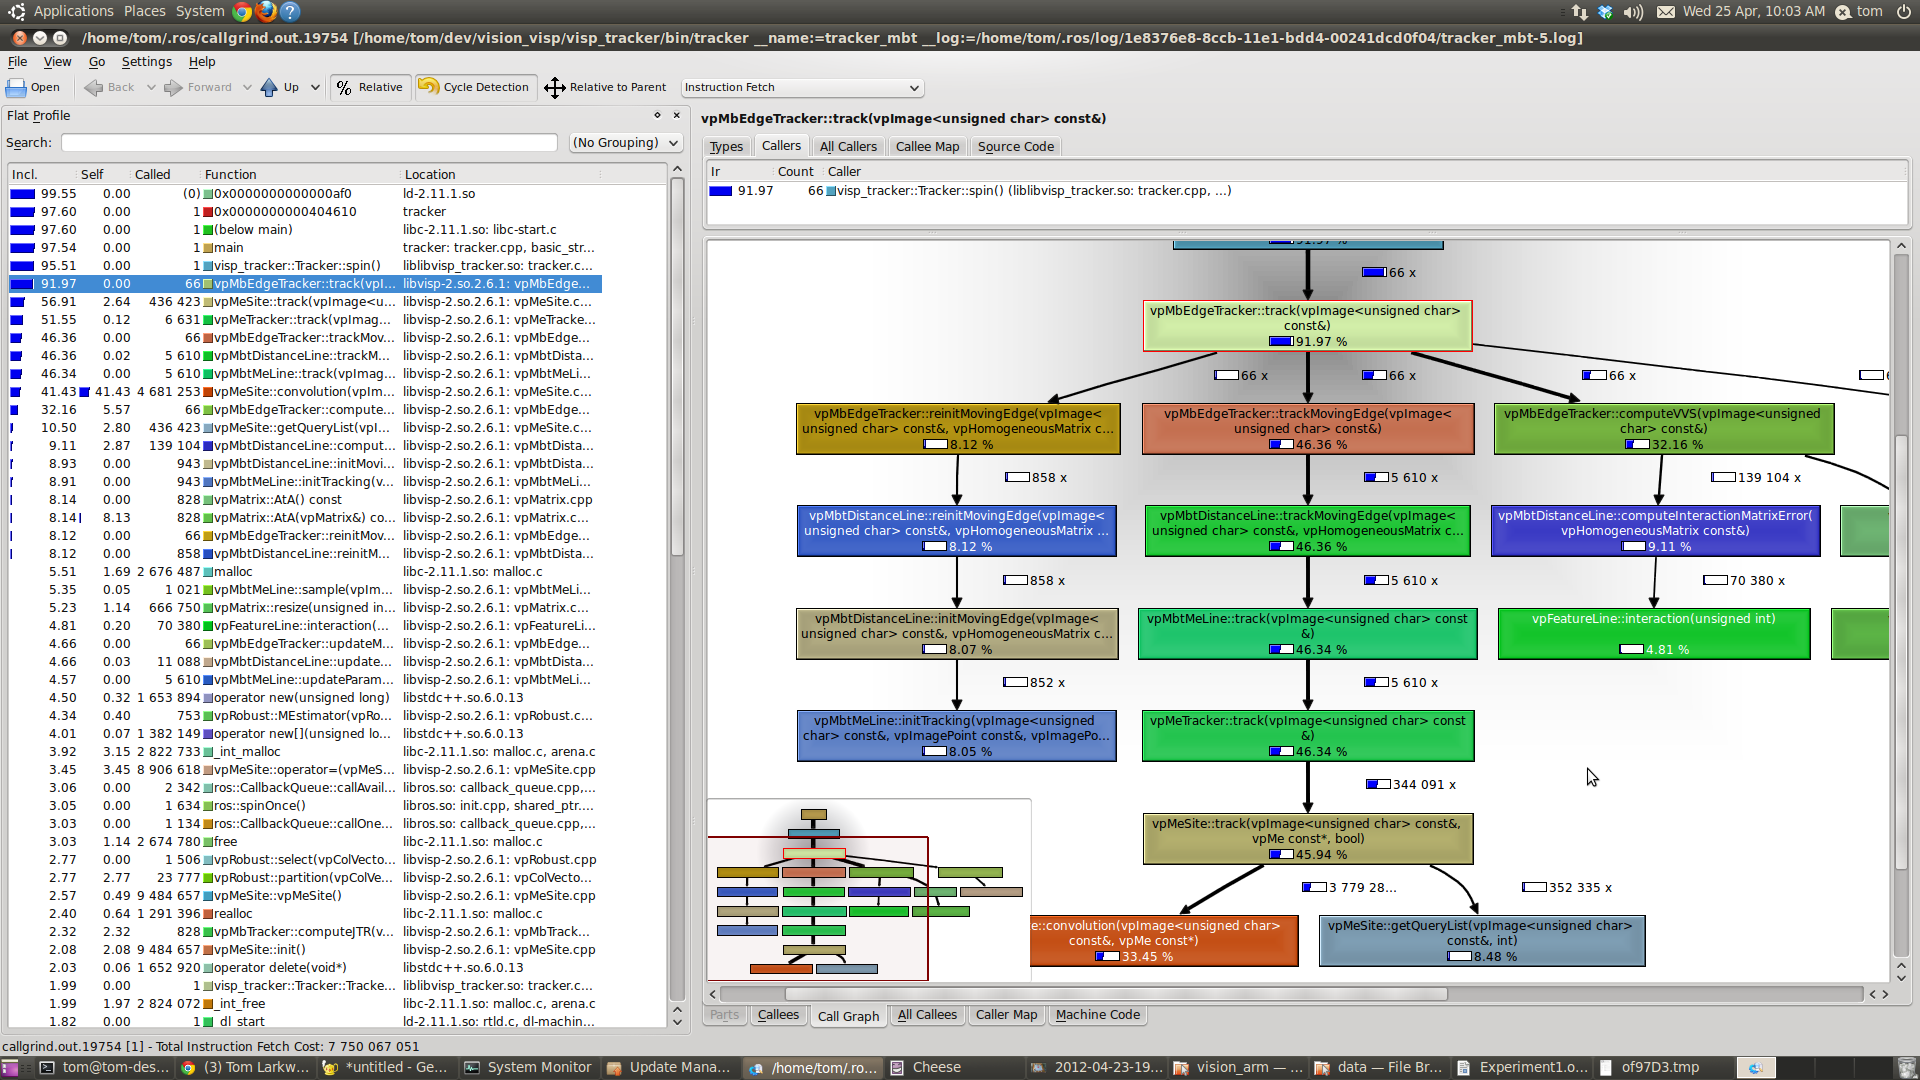
One comparison that could be quite handy would be using callgrind . The basic usage is like this:
valgrind --tool=callgrind zig build-exe ...
This will dump some profiling data into the cwd, which can be analyzed in a few different ways but I personally enjoy using kcachegrind, which looks something like this:
If you do multiple runs, kcachegrind will open them all up and show comparisons. Mainly, it will be interesting to see where most of the CPU instruction count is spent, compared to each other.
In order for this to work, you will need unstripped release builds of Zig. The binaries provided on the website are stripped. I’m happy to help with that if you need any assistance obtaining such binaries. It should be only a matter of passing -Dstrip=false to zig build.
7 Likes
matklad
August 25, 2023, 12:21pm
10
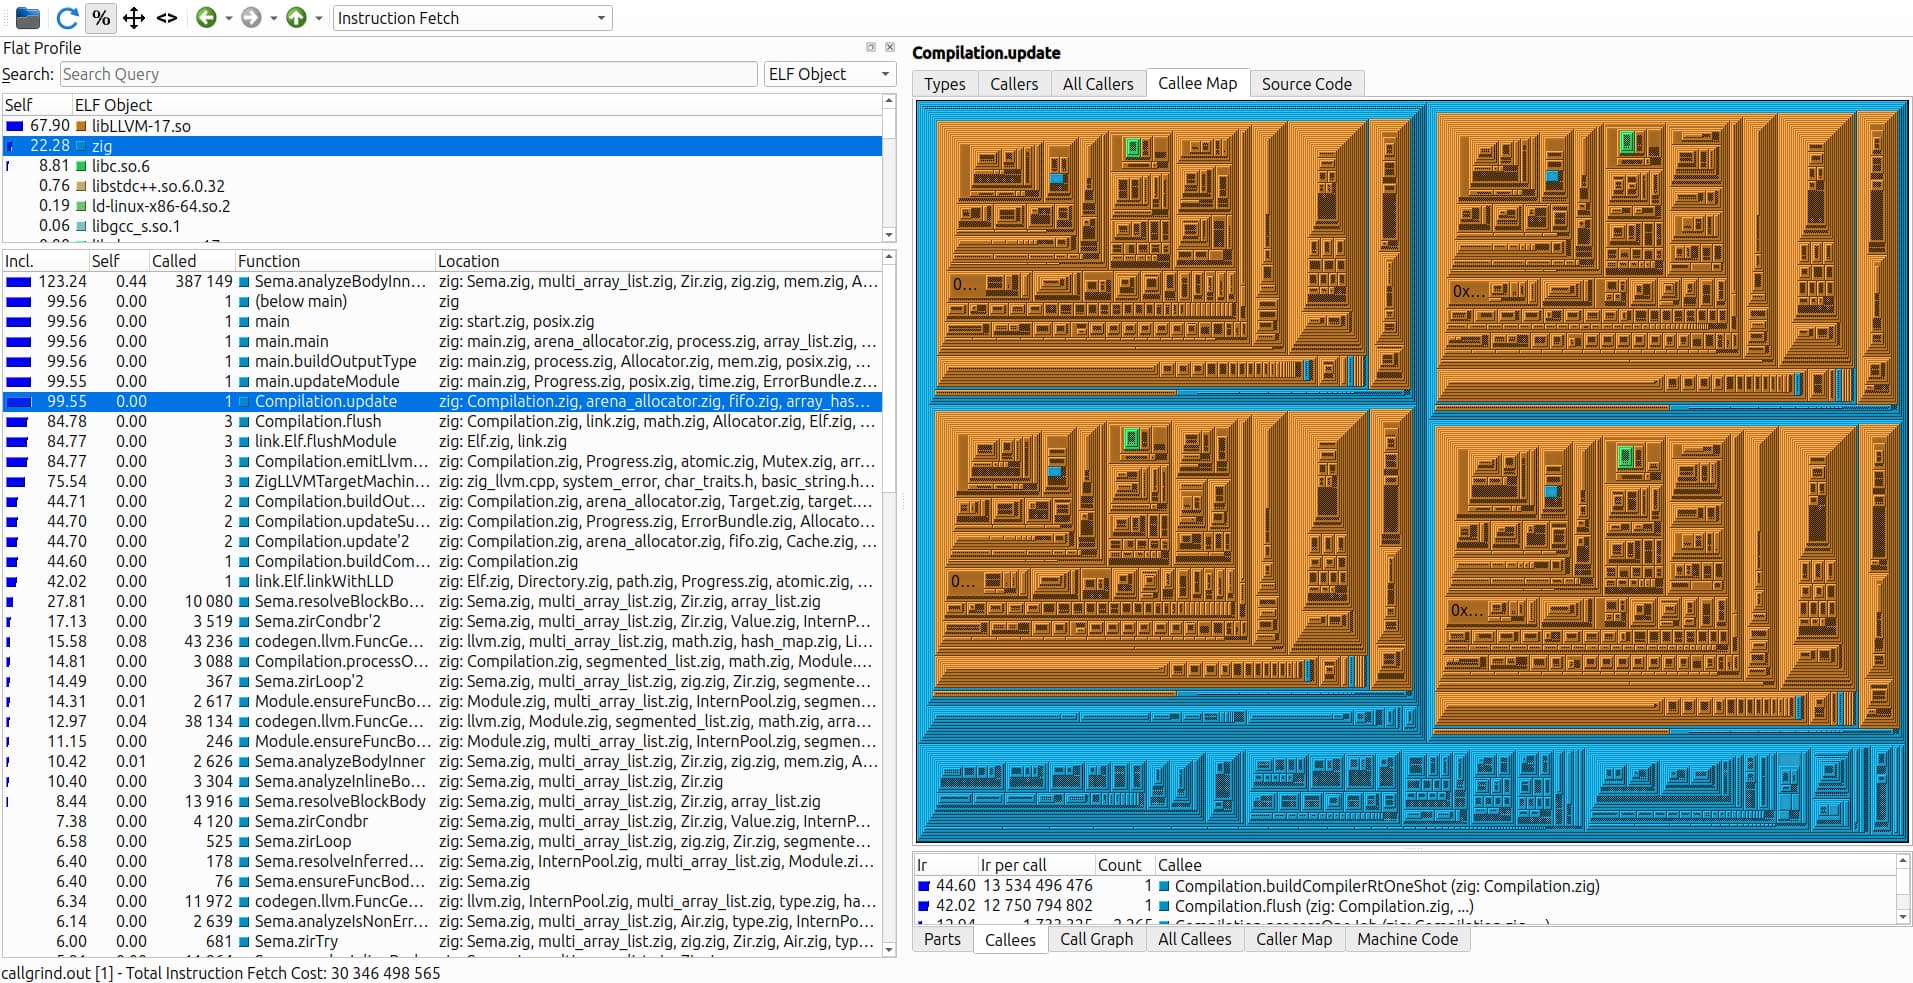
Captured flamegraphs. Could codegen.llvm.FuncGen.fieldPtr be quadratic?
Profiles:
4 Likes
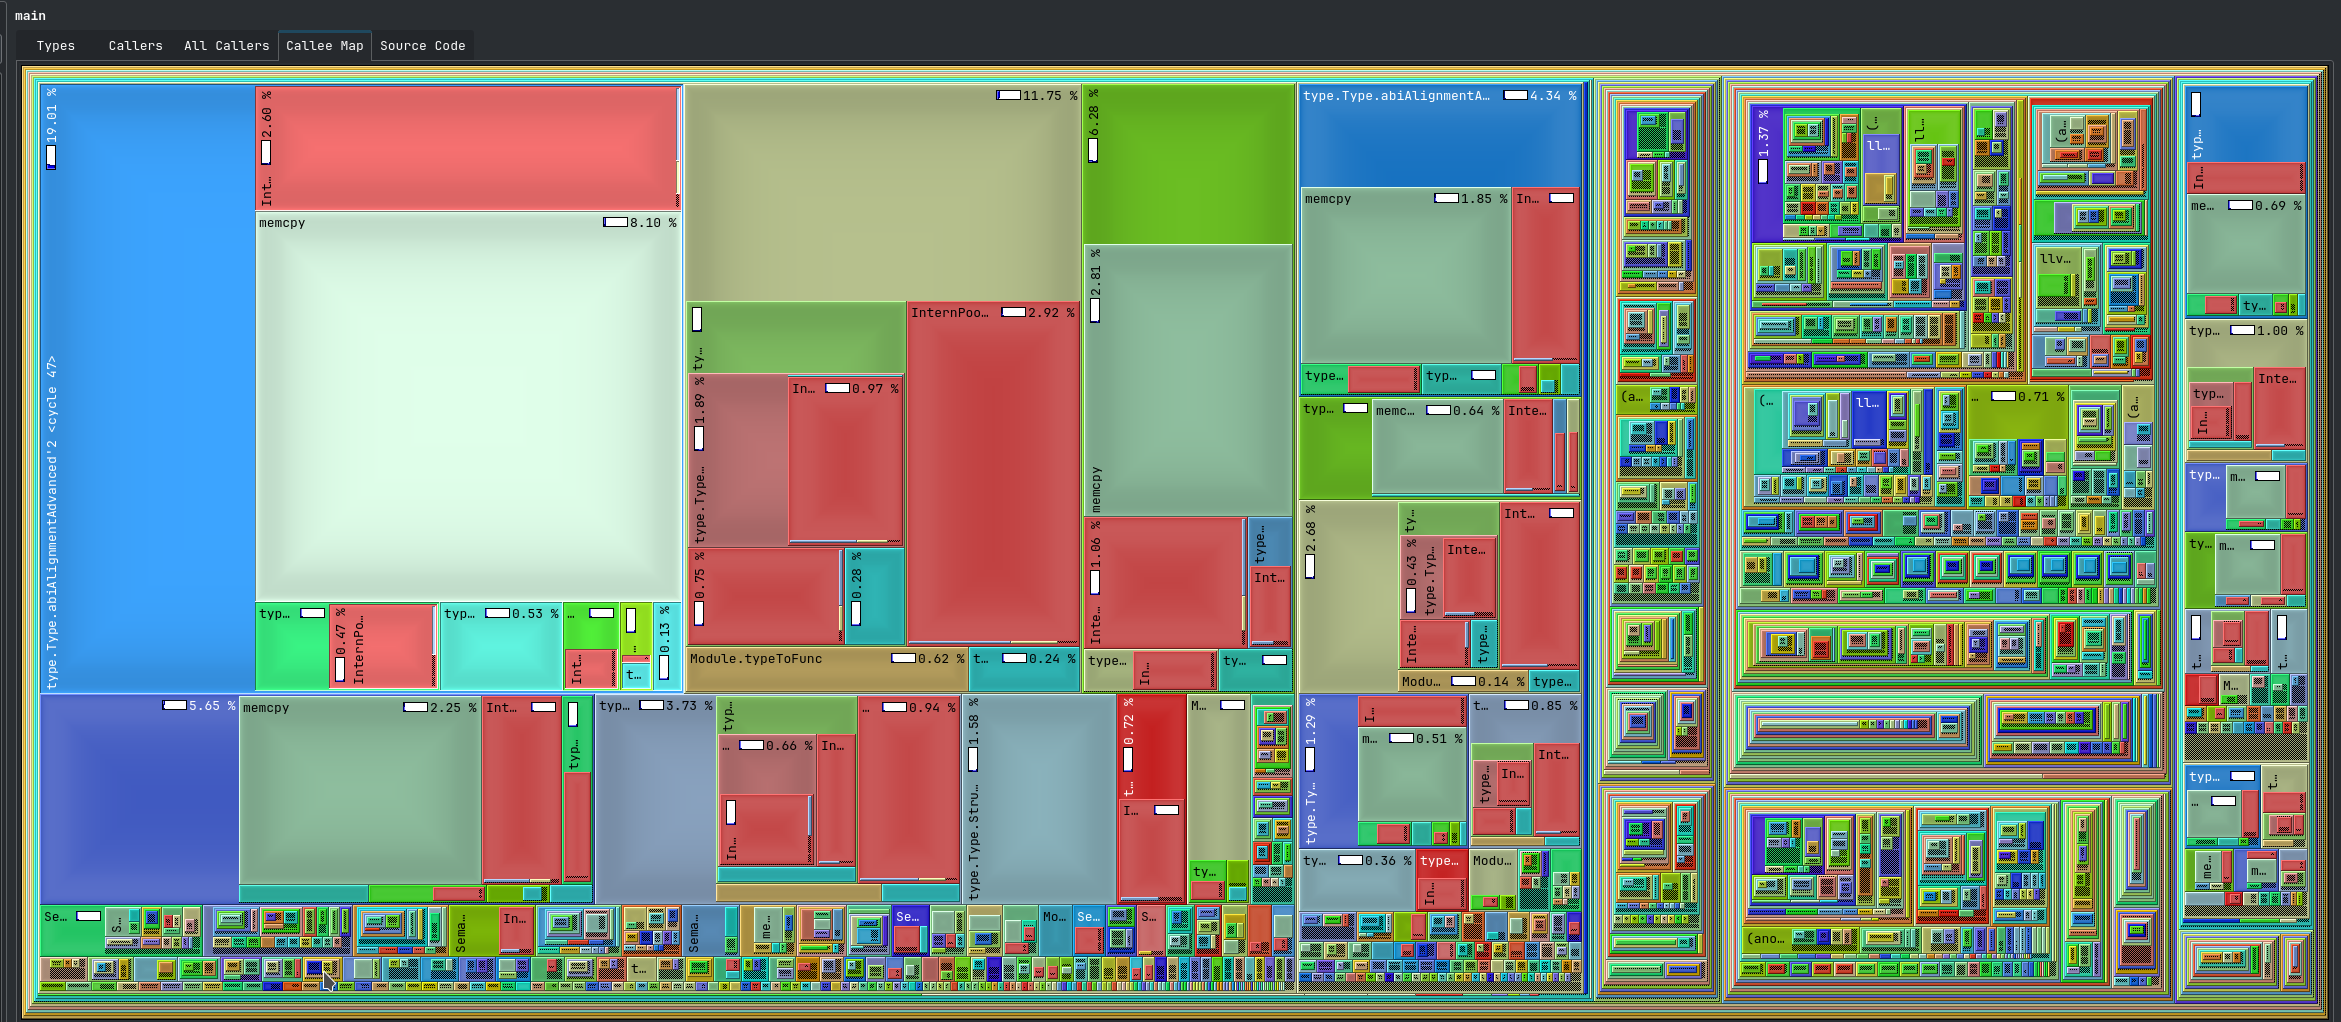
kcachegrind points to abiAlignmentAdvanced, and it seems like alingment&size recursively call each other:
So, yeah, it feels like something is quadratic and/or undercached in the compiler, but hard to say more without deeper knowledge of how this should work.
1 Like
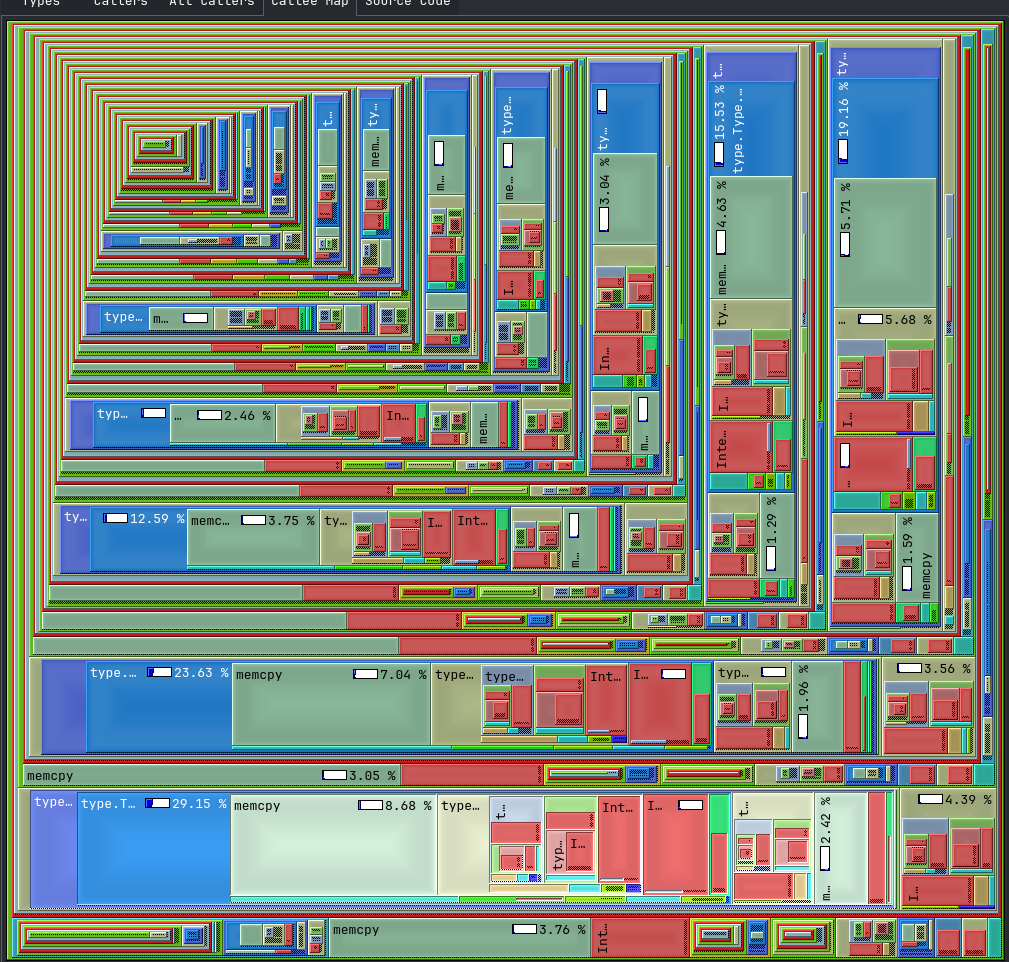
I got curious why perf and kcache grind point to related, but different functions… I think kcachegrind is just confused, as it thinks that abiSizeAdvanced takes 334.94% of total exectution time. Without cycle detection, abiSizeAdvanced looks like this in kcachegrind:
Those fractaly rectangles are the abiAlignmentAdvanced .
I consider the case closed with respect to who’s the culprit, not sure how to fix that though.
2 Likes
Those flame charts are really helpful, thank you! Interesting find indeed…
3 Likes
Hmm I think I see the problem. structs do actually cache their field offsets , however, at some point the LLVM backend stopped using that information and started doing its own calculations, which repeat the calculation every time. So if the zig source code initializes N fields, then this is O(N^2) calculations.
I’m working on migrating structs over to InternPool today, so it’s actually perfect timing for me to look into solving this perf regression as well.
If only Performance Tracking ⚡ Zig Programming Language was not bitrotted… I would love to have a tool like this available. Alas, it requires recurring operational maintenance, and I lack the time to keep it up and running.
10 Likes
@matklad , would you be willing to try a new build of master branch zig and see if the performance regressions you observed have been fixed? The changes in particular were done in compiler: move struct types into InternPool proper by andrewrk · Pull Request #17172 · ziglang/zig · GitHub which landed last week. This commit is reflected in the CI builds already if you wanted to use one of those builds.
There was a follow-up issue I looked into just now which was packedStructFieldByteOffset is implemented via O(N) linear search · Issue #17178 · ziglang/zig · GitHub however according to my measurements, storing the bit offsets of packed structs actually regressed performance rather than improving it, so I backed out of that change.
Much bigger things are coming soon on the performance roadmap ; this was just a little side quest along the way.
7 Likes
matklad
September 25, 2023, 1:05pm
16
Yup, much faster, debug build goes from 16s to 9s!
9 Likes
xbx
May 8, 2024, 8:03pm
17
Out of curiosity, I’ve run the same test to inclde the new zig-12.0 exe:
Benchmark 1 (8 runs): /bin/bash ./alldays.10_1_stage2.sh
  measurement          mean ± σ            min … max           outliers         delta
  wall_time          7.77s  ± 54.6ms    7.71s  … 7.88s           1 (13%)        0%
  peak_rss            285MB ±  187KB     284MB …  285MB          1 (13%)        0%
  cpu_cycles         26.9G  ±  244M     26.3G  … 27.1G           1 (13%)        0%
  instructions       32.8G  ± 8.70M     32.8G  … 32.9G           0 ( 0%)        0%
  cache_references   2.57G  ± 2.93M     2.57G  … 2.57G           0 ( 0%)        0%
  cache_misses        656M  ± 1.28M      655M  …  659M           0 ( 0%)        0%
  branch_misses       197M  ±  399K      196M  …  198M           0 ( 0%)        0%
Benchmark 2 (6 runs): /bin/bash ./alldays.10_1_stage1.sh
  measurement          mean ± σ            min … max           outliers         delta
  wall_time          10.3s  ±  144ms    10.1s  … 10.5s           0 ( 0%)        💩+ 32.1% ±  1.5%
  peak_rss            972MB ±  188KB     971MB …  972MB          0 ( 0%)        💩+241.3% ±  0.1%
  cpu_cycles         31.5G  ±  186M     31.2G  … 31.6G           0 ( 0%)        💩+ 17.1% ±  1.0%
  instructions       42.6G  ± 3.16M     42.6G  … 42.6G           0 ( 0%)        💩+ 29.8% ±  0.0%
  cache_references   2.55G  ± 8.07M     2.54G  … 2.56G           0 ( 0%)          -  0.8% ±  0.3%
  cache_misses        614M  ± 3.85M      610M  …  620M           0 ( 0%)        ⚡-  6.4% ±  0.5%
  branch_misses       192M  ±  687K      192M  …  193M           0 ( 0%)        ⚡-  2.4% ±  0.3%
Benchmark 3 (8 runs): /bin/bash ./alldays.11_0.sh
  measurement          mean ± σ            min … max           outliers         delta
  wall_time          8.00s  ±  103ms    7.86s  … 8.18s           0 ( 0%)        💩+  3.1% ±  1.1%
  peak_rss            298MB ±  266KB     298MB …  299MB          0 ( 0%)        💩+  4.8% ±  0.1%
  cpu_cycles         26.7G  ±  253M     26.2G  … 27.1G           1 (13%)          -  0.8% ±  1.0%
  instructions       33.3G  ± 6.33M     33.3G  … 33.3G           0 ( 0%)        💩+  1.4% ±  0.0%
  cache_references   2.55G  ± 5.64M     2.54G  … 2.56G           2 (25%)          -  1.0% ±  0.2%
  cache_misses        636M  ± 3.79M      630M  …  642M           0 ( 0%)        ⚡-  3.1% ±  0.5%
  branch_misses       183M  ±  477K      183M  …  184M           0 ( 0%)        ⚡-  6.9% ±  0.2%
Benchmark 4 (7 runs): /bin/bash ./alldays.12_0.sh
  measurement          mean ± σ            min … max           outliers         delta
  wall_time          8.97s  ±  107ms    8.81s  … 9.08s           0 ( 0%)        💩+ 15.5% ±  1.2%
  peak_rss            291MB ±  251KB     291MB …  292MB          0 ( 0%)        💩+  2.3% ±  0.1%
  cpu_cycles         29.7G  ±  251M     29.4G  … 30.0G           0 ( 0%)        💩+ 10.7% ±  1.0%
  instructions       39.3G  ± 14.2M     39.3G  … 39.3G           0 ( 0%)        💩+ 19.7% ±  0.0%
  cache_references   2.79G  ± 8.49M     2.78G  … 2.80G           0 ( 0%)        💩+  8.4% ±  0.3%
  cache_misses        631M  ± 3.46M      626M  …  635M           0 ( 0%)        ⚡-  3.9% ±  0.4%
  branch_misses       202M  ±  554K      201M  …  203M           0 ( 0%)        💩+  2.5% ±  0.3%
2 Likes