Buffered writer performance in comparison to rust

Hi yall! I want to start off by saying that I really like the zig project and it’s goal for making the language simple and explicit.

Very recently I have taken a liking to low level programming (Though I never dipped my toes), and I started following rust and zig’s development. But today I decided to dive in for a couple hours and see what it’s like.

After I did a couple of exercises here and there in both rust and zig I accidentally made a little benchmark of sorts.

Now before I continue, I’m fairly confident that I’m doing something sub-optimal in my implementation which is why I decided to post, and I’m pretty sure these comparisons with other languages (especially rust) are mostly not productive, but this is just my curiosity coupled with my ignorance in the field coming together.

I decided to make a simple password generator that randomly picks elements from an array that contains some ASCII characters, and each password is 32 characters long, And for some odd reason I decided to loop that entire process 1 million times, include a simple math op in the hot loop just for giggles and pipe the output into a file.

Here is that code in zig:

const std = @import("std");
const Random = std.Random;
const out = std.io.getStdOut();
pub fn main() !void {
    var stdout_buffer: [256]u8 = undefined;
    var stdout_writer = std.fs.File.stdout().writer(&stdout_buffer);
    const stdout = &stdout_writer.interface;
    const SOME_ASCII = [_]u8{
        'a', 'b', 'c', 'd', 'e', 'f', 'g', 'h', 'i', 'j', 'k', 'l', 'm', 'n', 'o', 'p', 'q', 'r',
        's', 't', 'u', 'v', 'w', 'x', 'y', 'z', 'A', 'B', 'C', 'D', 'E', 'F', 'G', 'H', 'I', 'J',
        'K', 'L', 'M', 'N', 'O', 'P', 'Q', 'R', 'S', 'T', 'U', 'V', 'W', 'X', 'Y', 'Z', '1', '2',
        '3', '4', '5', '6', '7', '8', '9', '!', '?', '/', '_', '#'
    };
    var seed: u64 = undefined;
    try std.posix.getrandom(std.mem.asBytes(&seed));
    var prng = Random.DefaultPrng.init(seed);
    const random = prng.random();
    var y: u64 = 0;
    for (0..1000000) |i| {
        if ((i / 4) == 0) {
            y = i % 13;
        }
        for (0..32) |_| {
            try stdout.print("{c}", .{SOME_ASCII[random.intRangeAtMost(u8, 0, 65)]});
        }
        try stdout.print("\n", .{});
    }
    try stdout.flush();
}

And here is the closest implementation that I was able to make in rust:

use std::io::{self, BufWriter, Write};
fn main() {
    const SOME_ASCII: [char; 66] = [
        'a', 'b', 'c', 'd', 'e', 'f', 'g', 'h', 'i', 'j', 'k', 'l', 'm', 'n', 'o', 'p', 'q', 'r',
        's', 't', 'u', 'v', 'w', 'x', 'y', 'z', 'A', 'B', 'C', 'D', 'E', 'F', 'G', 'H', 'I', 'J',
        'K', 'L', 'M', 'N', 'O', 'P', 'Q', 'R', 'S', 'T', 'U', 'V', 'W', 'X', 'Y', 'Z', '1', '2',
        '3', '4', '5', '6', '7', '8', '9', '!', '?', '/', '_', '#',
    ];
    let mut _y: u64 = 0;
    let stdout = io::stdout();
    let mut handle = BufWriter::new(stdout.lock());
    for i in 0..1000000 {
        if (i / 4) == 0 {
            _y = i % 13;
        }
        for _ in 0..=32 {
            write!(handle, "{}", SOME_ASCII[rand::random_range(0..=65)]).unwrap();
        }
        write!(handle, "\n").unwrap();
    }
}

Now, to figure out which implementation was faster, I initially used valgrind’s cachegrind to see cache misses (since I read that they were very expensive) as well as branch mispredictions like so:

valgrind --tool=cachegrind --cache-sim=yes --branch-sim=yes ./test -> out.txt

(To clarify, for zig I used version 0.15.2 with the ReleaseFast build flag, and for rust the default release profile)

With those metrics alone, zig was the clear winner from what I could tell, here are zig’s results following the valgrind command:

==6498==
==6498== I refs:        3,877,780,541
==6498== I1  misses:               53
==6498== LLi misses:               53
==6498== I1  miss rate:          0.00%
==6498== LLi miss rate:          0.00%
==6498==
==6498== D refs:        1,096,000,207  (632,000,153 rd   + 464,000,054 wr)
==6498== D1  misses:               41  (         29 rd   +          12 wr)
==6498== LLd misses:               41  (         29 rd   +          12 wr)
==6498== D1  miss rate:           0.0% (        0.0%     +         0.0%  )
==6498== LLd miss rate:           0.0% (        0.0%     +         0.0%  )
==6498==
==6498== LL refs:                  94  (         82 rd   +          12 wr)
==6498== LL misses:                94  (         82 rd   +          12 wr)
==6498== LL miss rate:            0.0% (        0.0%     +         0.0%  )
==6498==
==6498== Branches:        375,376,641  (372,376,640 cond +   3,000,001 ind)
==6498== Mispredicts:      12,164,014  ( 12,164,010 cond +           4 ind)

and here are rust’s results using that same command:

==6816== I refs:        3,804,788,630
==6816== I1  misses:            1,898
==6816== LLi misses:            1,799
==6816== I1  miss rate:          0.00%
==6816== LLi miss rate:          0.00%
==6816==
==6816== D refs:        1,439,370,448  (869,316,334 rd   + 570,054,114 wr)
==6816== D1  misses:            2,841  (      2,120 rd   +         721 wr)
==6816== LLd misses:            2,364  (      1,690 rd   +         674 wr)
==6816== D1  miss rate:           0.0% (        0.0%     +         0.0%  )
==6816== LLd miss rate:           0.0% (        0.0%     +         0.0%  )
==6816==
==6816== LL refs:               4,739  (      4,018 rd   +         721 wr)
==6816== LL misses:             4,163  (      3,489 rd   +         674 wr)
==6816== LL miss rate:            0.0% (        0.0%     +         0.0%  )
==6816==
==6816== Branches:        665,970,699  (599,955,262 cond +  66,015,437 ind)
==6816== Mispredicts:       1,549,783  (  1,549,413 cond +         370 ind)
==6816== Mispred rate:            0.2% (        0.3%     +         0.0%   )

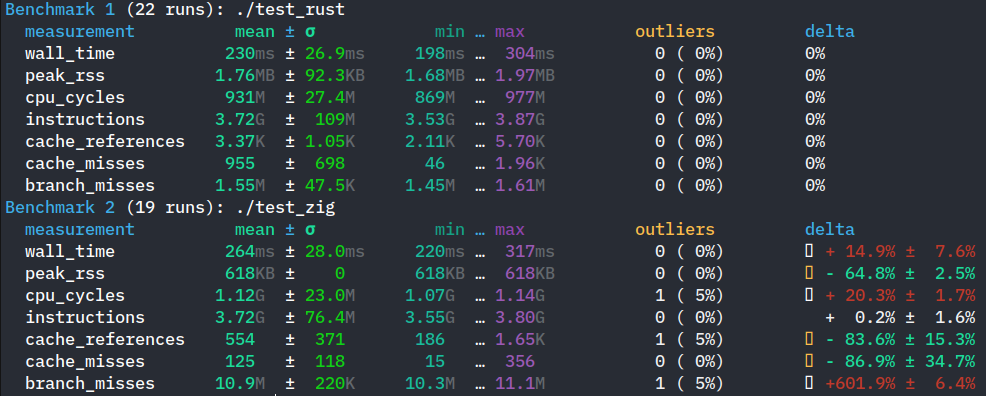
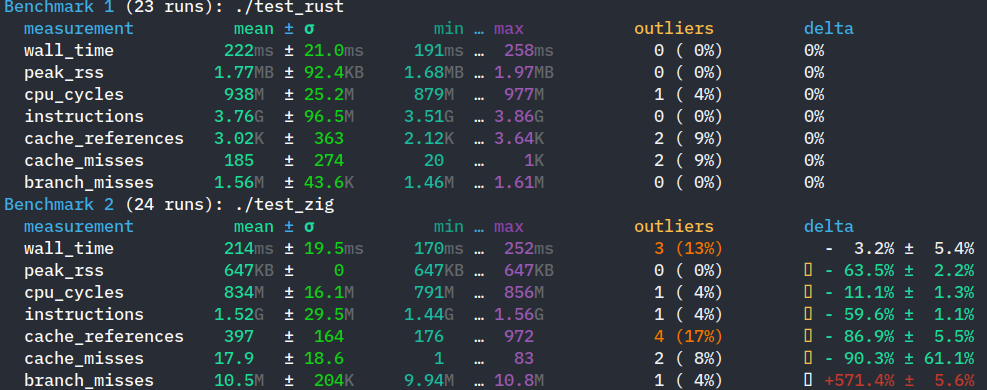
So with these results in mind, I assumed that when I measure the time of execution of each implementation, zig would be much faster, but I was almost surprised to see that the rust executable was almost consistently 80 to a 100ms faster on my machine, here is a sample output:

zig:

time ./test -> output.txt

real	0m0.364s
user	0m0.276s
sys	0m0.087s

rust:

time ./target/release/test -> output.txt

real	0m0.267s
user	0m0.226s
sys	0m0.027s

Now I ran those measurements multiple times under similar conditions and the difference was consistent which made me feel like this wasn’t a within a margin of error type of situation.

So to try to make even a little sense of where this difference was coming from, I decided to use KCachegrind with the hope that beautiful graphs, shapes and colors would help me understand something (It didn’t).

To get those visualizations I used the callgrind tool from valgrind for KCachegrind to consume, here is that command:

valgrind --tool=callgrind --cache-sim=yes --branch-sim=yes ./test -> out.txt

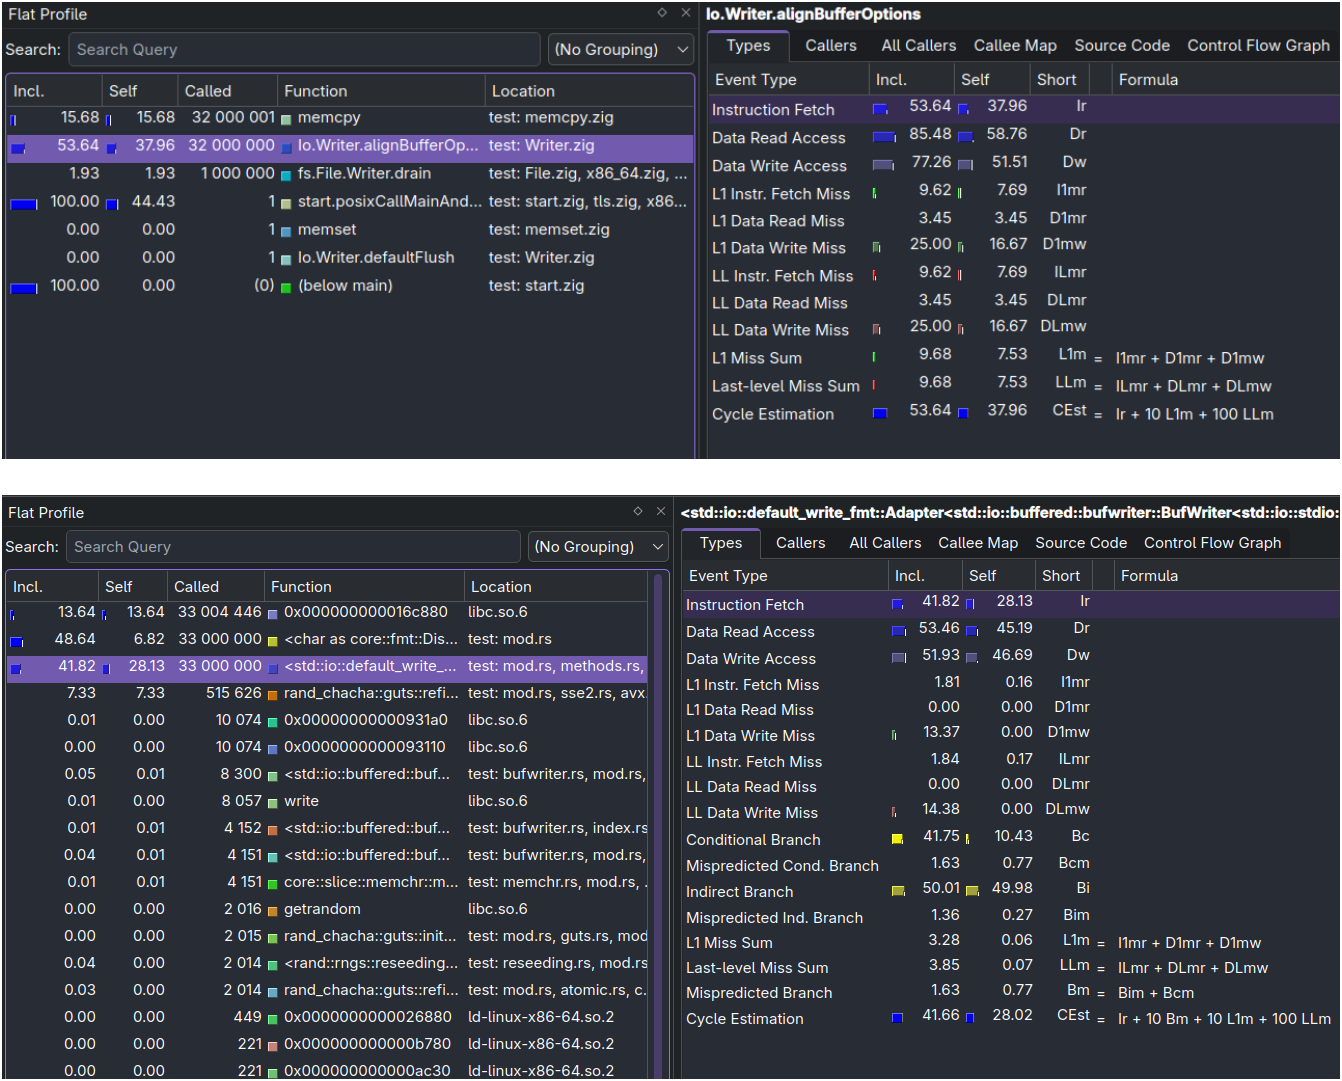
The upper image is zig’s binary visualization, while the bottom one is rust’s.

For the sake of not having to merge too many screenshots, I focused on 2 functions, the Io.Writer.alignBufferOptions in the zig screenshot since I believe It’s the subject of interest here and I focused and the std::io::default_write_fmt function in rust’s screenshot since I assumed that it maybe serves the same purpose as the Io.Writer.alignBufferOptions function in zig’s output, though I could be wrong.

Now this is where I reached my limits of understanding what could be going on, other than the weird fact that There are 33 million calls to 3 functions in rust in comparison to 2 functions getting called 32 million times as one would expect (Maybe somehow the newline character that I insert after every line counts here?)

The thing that stood out to me is in the event types “Instruction Fetch” , “Data Read Access” and “Data Write Access” which I would assume to be the main pieces here, zig has a lot more number of instructions generated by those types than rust, like Data Write Access: 77.26k as opposed to rust’s Data Write Access: 51.23k etc…

I don’t know if those numbers indicate that rust might have a more optimized implementation or if I’m at fault, but whatever it might be, rust seems to have an edge in execution time.

I would love for someone to explain if there is something different that I can do to reach or exceeds the IO throughput in comparison to rust’s, I would love for this to be a mistake on my part rather than a slightly less optimized implementation in zig’s std library, but hey, if by any chance I helped uncover a potential area of improvement, then I’m also contented.

Thank you to whoever takes the time to take a look at this and thank you to the zig team for your efforts! can’t wait to play around with zig even more in the coming days!

Most important thing would be to ensure that the buffer sizes are the same between the benchmarks. I could be wrong, but it seems like the Rust version is using the default size of 8KiB while the Zig version is using 256 bytes.

This difference would show up in the number of write syscalls happening. Try running

strace -c ./test

and

strace -c ./target/release/test

to compare the number of syscalls being performed.

1 Like

Hey thank you for the response!

I forgot to mention that I did actually experiment a bit with the buffer size to see if there was a tangible difference in the time of execution, It does indeed lower the number of calls to pwritev significantly, from 128405 calls with a buffer size of 256 bytes to 4028 with 8kb buffer size. While in rust write is called 8057 with no changes.

However running the time commands again and again shows the same 80 to 100ms difference and KCachegrind shows the exact same thing, where the instructions generated by the Io.Writer.alignBufferOptions is still pretty much exactly the same as the screenshot I provided and still much higher than that of rust’s.

Could try using poop (or this fork) to compare them statistically instead of eyeballing it.

I think you’re past the buffer size issue, but if you want to make the two tests more similar you could use BufWriter::with_capacity in the Rust test.

Well It’s pretty much what I expected, I think this might actually be an indicator that zig’s actual implementation of the buffered writer has some room for improvement, what do you think?

1 Like

My guess is that it’s the formatted printing that has room for improvement. From the huge difference in branch misses, my guess is that this logic might be relevant.

Try modifying the Zig version to call writeByte directly instead of going through print and see how much that affects things.

        for (0..32) |_| {
            try stdout.writeByte(SOME_ASCII[random.intRangeAtMost(u8, 0, 65)]);
        }
        try stdout.writeByte('\n');

(note: this will make the benchmarks an unfair comparison, we’re just trying to identify what’s causing the branch misses)

From what I can tell from the docs and the rust forums BufWriter::with_capacity basically allows you to specify the buffer size like the zig implementation, since the default in rust is 8k and I set the buffer size to 8k in zig too, there is no need to change it I think, since now they’re equivalent

Sure, I just thought relying on the default was slightly risky.

Well, that’s a drastic difference, everything but the branch misses, I can’t think of anything else that could cause the excessive misses other than maybe the prng and rand related stuff?

Removing the randomness does have a large effect (both versions I’m testing use writeByte instead of print):

            try stdout.writeByte(SOME_ASCII[i % SOME_ASCII.len]);
Benchmark 1 (22 runs): ./bufwrite
  measurement          mean ± σ            min … max           outliers         delta
  wall_time           233ms ± 1.41ms     231ms …  237ms          0 ( 0%)        0%
  peak_rss            131KB ±    0       131KB …  131KB          0 ( 0%)        0%
  cpu_cycles          961M  ± 3.21M      956M  …  969M           1 ( 5%)        0%
  instructions       1.55G  ± 56.3K     1.55G  … 1.55G           0 ( 0%)        0%
  cache_references   85.9K  ± 42.9K     28.0K  …  195K           0 ( 0%)        0%
  cache_misses       7.87K  ± 5.13K     1.50K  … 19.5K           0 ( 0%)        0%
  branch_misses      11.2M  ± 62.7K     11.1M  … 11.3M           1 ( 5%)        0%
Benchmark 2 (74 runs): ./bufwrite-nonrandom
  measurement          mean ± σ            min … max           outliers         delta
  wall_time          68.9ms ± 28.9ms    35.4ms …  114ms          0 ( 0%)        ⚡- 70.5% ±  5.3%
  peak_rss            131KB ±    0       131KB …  131KB          0 ( 0%)         -  0.0% ±  0.0%
  cpu_cycles          271M  ±  123M      141M  …  468M           0 ( 0%)        ⚡- 71.8% ±  5.5%
  instructions        308M  ± 29.0       308M  …  308M           0 ( 0%)        ⚡- 80.1% ±  0.0%
  cache_references   42.0K  ± 42.5K     3.14K  …  278K           4 ( 5%)        ⚡- 51.1% ± 23.9%
  cache_misses       3.42K  ± 4.28K      166   … 30.6K           4 ( 5%)        ⚡- 56.6% ± 27.5%
  branch_misses      16.1K  ±  339      15.6K  … 17.4K           5 ( 7%)        ⚡- 99.9% ±  0.1%

Not fully sure what we can glean from that, though. Would likely need to compare the generated assembly to see if the i % SOME_ASCII.len version unlocks more optimizations than expected.

Ah, ok, found something that makes sense. Two versions of the PRNG version:

Unbiased (slight variation of the version in the OP, same runtime performance):

try stdout.writeByte(SOME_ASCII[random.uintLessThan(u8, SOME_ASCII.len)]);

Biased (not guaranteed to have an even distribution, does a lot less work):

try stdout.writeByte(SOME_ASCII[random.uintLessThanBiased(u8, SOME_ASCII.len)]);

Results:

Benchmark 1 (22 runs): ./bufwrite-unbiased
  measurement          mean ± σ            min … max           outliers         delta
  wall_time           236ms ± 7.03ms     232ms …  259ms          3 (14%)        0%
  peak_rss            131KB ±    0       131KB …  131KB          0 ( 0%)        0%
  cpu_cycles          962M  ± 2.46M      959M  …  968M           0 ( 0%)        0%
  instructions       1.55G  ± 51.5K     1.55G  … 1.55G           0 ( 0%)        0%
  cache_references   75.1K  ± 24.5K     40.1K  …  130K           0 ( 0%)        0%
  cache_misses       6.05K  ± 2.91K     2.09K  … 13.2K           0 ( 0%)        0%
  branch_misses      11.2M  ± 35.9K     11.2M  … 11.3M           0 ( 0%)        0%
Benchmark 2 (32 runs): ./bufwrite-biased
  measurement          mean ± σ            min … max           outliers         delta
  wall_time           159ms ± 7.08ms     156ms …  187ms          2 ( 6%)        ⚡- 32.7% ±  1.7%
  peak_rss            131KB ±    0       131KB …  131KB          0 ( 0%)         -  0.0% ±  0.0%
  cpu_cycles          646M  ± 1.78M      642M  …  652M           2 ( 6%)        ⚡- 32.8% ±  0.1%
  instructions       1.13G  ± 9.56      1.13G  … 1.13G           2 ( 6%)        ⚡- 27.1% ±  0.0%
  cache_references   57.7K  ± 31.2K     22.9K  …  142K           1 ( 3%)        ⚡- 23.1% ± 21.2%
  cache_misses       4.20K  ± 3.09K      954   … 11.2K           0 ( 0%)        ⚡- 30.5% ± 27.7%
  branch_misses      16.4K  ±  352      16.1K  … 17.4K           3 ( 9%)        ⚡- 99.9% ±  0.1%
Benchmark 3 (89 runs): ./bufwrite-nonrandom
  measurement          mean ± σ            min … max           outliers         delta
  wall_time          56.5ms ± 26.3ms    35.4ms …  128ms          2 ( 2%)        ⚡- 76.1% ±  4.8%
  peak_rss            131KB ±    0       131KB …  131KB          0 ( 0%)         -  0.0% ±  0.0%
  cpu_cycles          212M  ±  104M      141M  …  467M           8 ( 9%)        ⚡- 78.0% ±  4.6%
  instructions        308M  ± 27.0       308M  …  308M           1 ( 1%)        ⚡- 80.1% ±  0.0%
  cache_references   26.9K  ± 33.2K     3.34K  …  192K          14 (16%)        ⚡- 64.1% ± 19.9%
  cache_misses       1.94K  ± 3.00K      163   … 18.2K          14 (16%)        ⚡- 68.0% ± 23.3%
  branch_misses      16.0K  ±  284      15.6K  … 17.6K           4 ( 4%)        ⚡- 99.9% ±  0.1%

So, the lesson here is that the unbiased versions of the functions in Random have a non-trivial cost. I’m not familiar enough with the Random code to know if that’s unexpected.

2 Likes

Welp, I was going to reply saying if I should check which algorithm the rand crate uses and try to see if something like it exists in zig, but I guess there’s a simpler answer, that’s such an interesting find so thank you so much for that, I’m not familiar with random algorithms in general too, but it makes sense if the algo is actively trying to keep some type of distribution.

Again thank you for going through this and investigating, it was a nice little dive!

And if you find anything else of interest I’m all ears.

1 Like