More changes to reduce the number of allocations.
- Previously
Array.containersfield was a[*]*Container. No good reason for the extra indirection except that I was following CRoaring. And now its[*]Container. - Previously
Container.blockswas a separate allocation. And now blocks are allocated together with each container.
So Containers are now allocated (like Array) with a flexible blocks field. I noticed my allocation failures test time is about half what it was before. This change has improved most measurements in the following benchmark, most notably cache misses.
$ poop zig-out/bin/bench-cr zig-out/bin/bench-zr
zig build -Dbench-target=cr -Doptimize=ReleaseFast && zig build -Dbench-target=zr -Doptimize=ReleaseFast && poop zig-out/bin/bench-cr zig-out/bin/bench-zr
Benchmark 1 (575 runs): zig-out/bin/bench-cr
  measurement          mean ± σ            min … max           outliers         delta
  wall_time          8.64ms ±  278us    8.09ms … 11.5ms          9 ( 2%)        0%
  peak_rss           5.94MB ±  100KB    5.64MB … 6.26MB         72 (13%)        0%
  cpu_cycles         27.0M  ±  446K     26.5M  … 33.4M          25 ( 4%)        0%
  instructions       69.3M  ± 3.46      69.3M  … 69.3M          28 ( 5%)        0%
  cache_references   2.24M  ± 22.9K     2.18M  … 2.36M          21 ( 4%)        0%
  cache_misses        221K  ± 4.52K      206K  …  241K          13 ( 2%)        0%
  branch_misses       130K  ± 1.94K      126K  …  137K           1 ( 0%)        0%
Benchmark 2 (603 runs): zig-out/bin/bench-zr
  measurement          mean ± σ            min … max           outliers         delta
  wall_time          8.25ms ±  199us    7.79ms … 9.11ms          7 ( 1%)        ⚡-  4.5% ±  0.3%
  peak_rss           5.47MB ± 64.1KB    5.19MB … 5.61MB         19 ( 3%)        ⚡-  8.0% ±  0.2%
  cpu_cycles         26.8M  ±  323K     26.4M  … 29.9M          27 ( 4%)          -  0.7% ±  0.2%
  instructions       69.4M  ± 3.70      69.4M  … 69.4M          15 ( 2%)          +  0.2% ±  0.0%
  cache_references   2.34M  ± 29.1K     2.26M  … 2.57M          22 ( 4%)        💩+  4.5% ±  0.1%
  cache_misses        216K  ± 4.27K      205K  …  239K           9 ( 1%)        ⚡-  2.3% ±  0.2%
  branch_misses       110K  ± 1.34K      107K  …  115K          15 ( 2%)        ⚡- 15.5% ±  0.1%
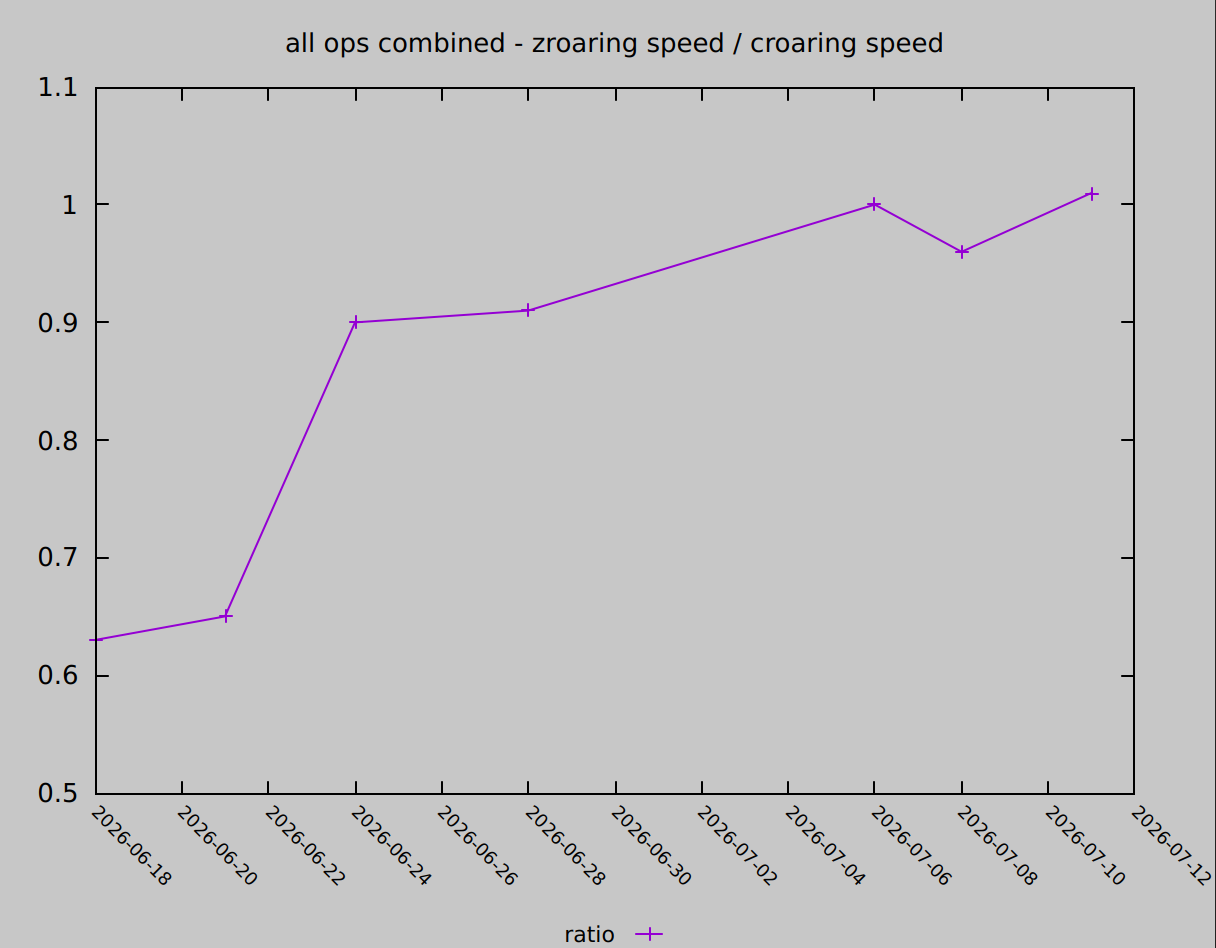
This is the first time we’ve been faster than CRoaring  . I haven’t been sharing this one here, but previously CRoaring was between 5% and 15% faster on this one in the past month.
$ zig build bench -Doptimize=ReleaseFast
$ zig build bench -Doptimize=ReleaseFast -- write_csv_row
----------------------------------------------------
overall:
----------------------------------------------------
CRoaring: 30520 ops 97.042ms   0.315MB ops/sec
ZRoaring: 30520 ops 96.418ms   0.317MB ops/sec

                                 ratio -- 1.006 👍🏻

----------------------------------------------------
individual ops: speed=ops/sec
----------------------------------------------------
op                   cr speed zr speed #    ratio
----------------------------------------------------
clear                0.67MB   0.96MB   990  1.42  ⚡
run_optimize         0.42MB   0.34MB   1200 0.80  🥔
shrink_to_fit        4.30MB   5.23MB   940  1.22  ⚡
portable_serialize   1.54MB   1.09MB   540  0.71  💩
frozen_serialize     3.50MB   2.39MB   420  0.68  💩
minimum              23.49MB  26.29MB  230  1.12  ⚡
maximum              17.68MB  16.55MB  290  0.94  👍🏻
add                  11.58MB  11.71MB  5150 1.01  👍🏻
rank                 11.30MB  11.01MB  390  0.97  👍🏻
select               8.28MB   6.97MB   360  0.84  🥔
contains             17.33MB  16.74MB  200  0.97  👍🏻
add_many             2.65MB   2.54MB   2280 0.96  👍🏻
add_range_closed     2.64MB   2.19MB   3690 0.83  🥔
contains_range       15.34MB  15.91MB  360  1.04  👍🏻
range_cardinality    14.84MB  15.85MB  330  1.07  👍🏻
remove               13.86MB  14.44MB  1760 1.04  👍🏻
and                  0.30MB   0.31MB   1190 1.03  👍🏻
or                   191.93kB 196.96kB 950  1.03  👍🏻
xor                  167.31kB 162.64kB 1170 0.97  👍🏻
andnot               194.80kB 0.28MB   1010 1.44  ⚡
lazy_or              137.32kB 117.23kB 920  0.85  🥔
or_inplace           0.31MB   0.27MB   1090 0.85  🥔
and_inplace          0.33MB   0.33MB   540  1.01  👍🏻
is_subset            182.30kB 197.39kB 650  1.08  ⚡
equals               9.81MB   25.78MB  330  2.63  ⚡
and_cardinality      2.37MB   2.26MB   300  0.95  👍🏻
or_cardinality       1.42MB   1.47MB   380  1.03  👍🏻
xor_cardinality      1.46MB   1.45MB   350  0.99  👍🏻
andnot_cardinality   1.33MB   1.34MB   240  1.01  👍🏻
jaccard_index        0.48MB   0.53MB   280  1.11  ⚡
or_many              12.50kB  13.44kB  570  1.08  ⚡
portable_deserialize 154.42kB 195.40kB 340  1.27  ⚡
statistics           4.89MB   5.10MB   310  1.04  👍🏻
flip                 189.46kB 93.35kB  440  0.49  💩
frozen_view          1.63MB   1.00MB   330  0.61  💩
@xsawyerx we’re sligntly faster than CRoaring now on your benchmark  . Now you have no reason to use CRoaring except for binary size
  .
.
Vind benchmark
[~/.../zig/vind]$ zig build bench -Droaring=c

timings
  build         753.437 ms         66363 docs/s
  finalize        7.962 ms       6280130 docs/s
  serialize       5.351 ms    1332837062 bytes/s
  deserialize   740.708 ms         67503 docs/s
  total        1507.458 ms
...
  combined total 2299.986 ms
[~/.../zig/vind]$ zig build bench -Droaring=zig

timings
  build         712.943 ms         70132 docs/s
  finalize        7.503 ms       6664204 docs/s
  serialize       5.288 ms    1348710113 bytes/s
  deserialize   724.253 ms         69037 docs/s
  total        1449.987 ms
...
  combined total 2214.106 ms