I’d say that user-friendly profiling of native code is an unsolved problem as of today. I need to profile stuff roughly couple of times a year, and every time it’s a slow slog to recall which tool I used last time to get decent results. That being said, my current tool of choice is:
The catch is that one does not simply “use perf” — this tool has like a bajilion obscure options, and you need to shove its results to some other tool to get anything useful. I just can’t remember all that. They way I solved that problem is by putting the spell that worked for me once into my own script and re-using that since:
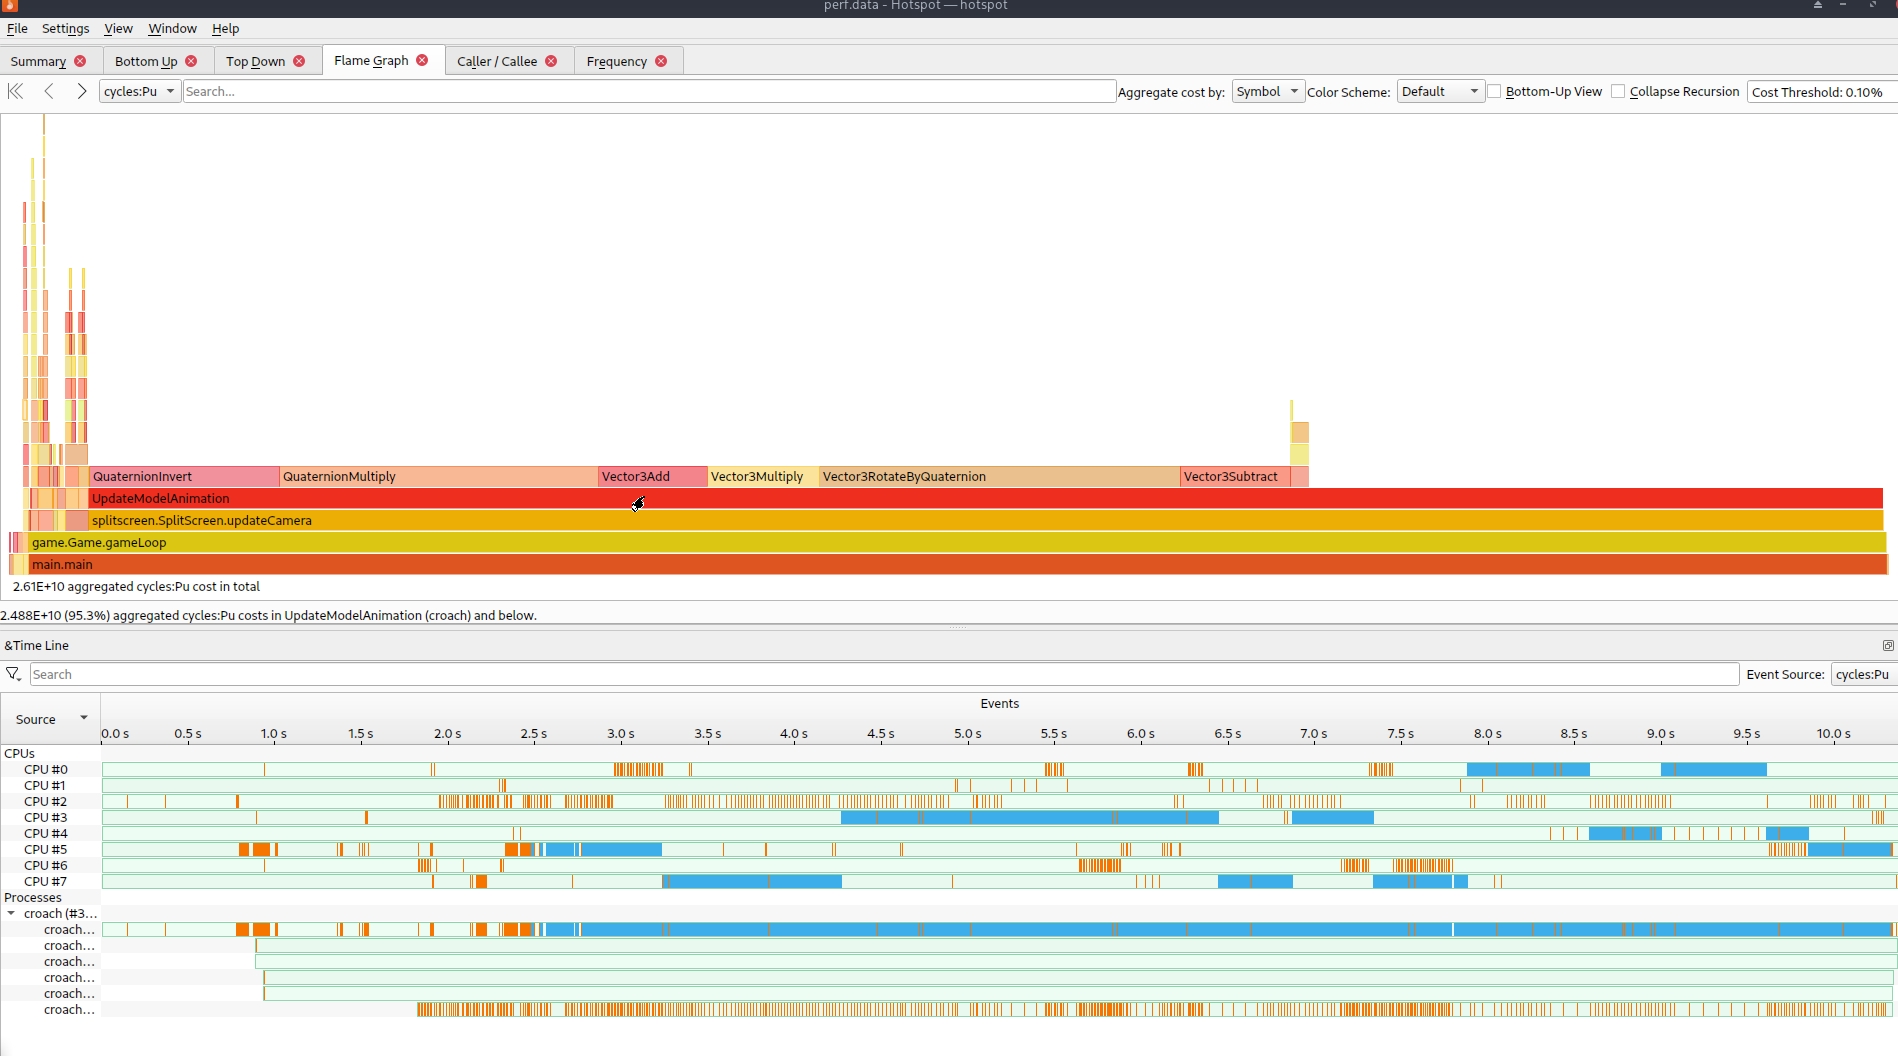
Have you tried using hotspot instead of perf+firefox?
It has an integrated interactive flame graph, also shows cpu bar diagrams below it and a bunch of other views . You can run your program with it directly and it takes care of recording the perf data and then displaying it.
It also seems to automatically download debug information for things.
It can’t do everything perf can, but I don’t want to fiddle around with perf directly unless I have to.
sidenote: this is from a program that does barely anything which is why there isn’t that much interesting to see here
As long as a sampling profiler is enough, I think this gives you the best usage experience, from the things I have tried. In terms of getting it to run and using it.
If you need tracing too, than spending the time to get tracy to work (I had problems the last time I tried, which is probably a year ago or so) might be worth it (because it supports both sampling and tracing), additionally if you have the desire / need to look at the results while the program is running, instead of after you have closed down the program.
Although with hotspot you could attach to a running process for a short time and then view the results, and do that a few times at interesting times of the applications life time, to have a poor man’s imitation of the live time-based filtering that can be done with tracy. You can filter to zoom in on a specific section in the timeline with hotspot, you just can’t do that while hotspot is still in recording mode.
To add another thing, I would remove the allocator field from the Node and instead pass the allocator into functions wherever it is needed, that should save you a bunch of memory and probably also make your program faster by creating more cache locality (because more nodes fit into one cacheline / page).
Next step after that: I would try to replace the pointers with u32 indicies instead and put all the nodes into a data structure that can be allocated in chunks / slabs, without having to re-allocate all the time.
If that turned out to be not enough, then you are back to using an HAMT Hash Array-Mapped Trie, which was already suggest by @validark, or the data structure he has proposed, that optimizes that even more.
I am working on a HAMT, but I am still not quite sure when I will be done with that. (I am reorganizing some things in the code and want to have good support for using pointers or indicies)
The trick mentioned by @validark was reified by this paper [1] into a datastructure called “Stencilvector” basically combining the bit-mask + array as one thing. I am using that as an internal node, that typically has a branching factor of 8 16 or 32 based on the size of the Index/Pointer type, the amount of needed bit-masks and different strategies to pack the key and value into the slots of the stencil vector in a way that saves memory.
My current plan is to do a bit more re-organizing of the code, to simplify the implementation, create more tests and better documentation and then create a first public package relatively soon.