I agree with this sentiment, at the same time, there’s nothing stopping the next debugger from being written in Zig. It could support everything which GDB and LLDB cover already, as well as providing better hooks for languages those two aren’t doing as good a job with.
This would be many human-years of labor, of course, and just patching and extending LLDB might be easier. But a debugger is exactly the kind of low-level system-oriented programming which Zig excels at. Sometimes the right thing to do is start fresh, with a system which doesn’t fundamentally assume it will be looking at either C or C++, an architecture which lets languages register specifics in an extensible way which covers bases for the next language as well.
LLVM itself was Chris Lattner realizing that it would be more practical to re-engineer the entire C/C++ compilation chain from end to end, rather than try to get GCC to work the way he thought it should. There’s precedent.
Visual Studio is not dedicated or specific to C#. It is a general IDE that supports many languages through extensions. This extensibility permeates all the functions of the IDE, from syntax highlighting to the project system, to the debugger. Anyone can add language support through the extensibility model. In its history, it has had support for C/C++, Pascal, Fortran, Cobol, Java, typescript, javascript, and others.
I don’t have a good debugging strategy for debugging Zig on Windows (particularly since I dislike VSCode very much) but on Linux I just use gdb. It’s able to work with it quite well from my experience. But dedicated support in debuggers would always be better.
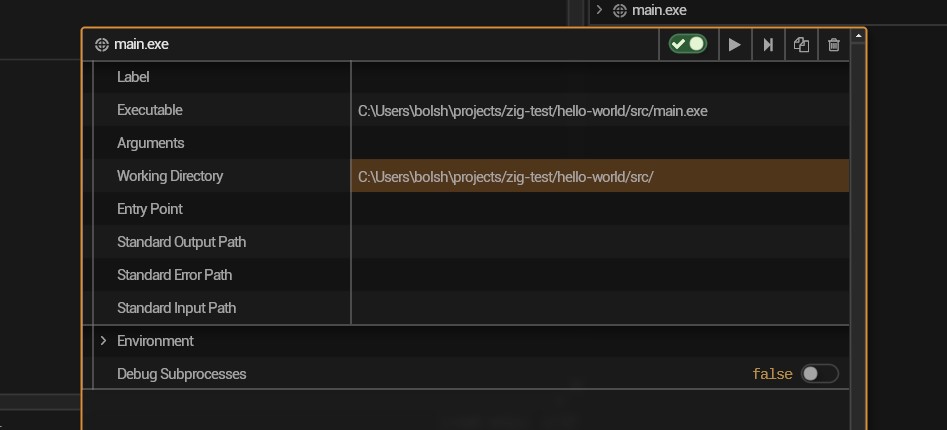
Wow, the RAD debugger works much better than what I expected, especially for an alpha project. Memory, registers, breakpoints – it’s definitely a good start.
I’ve been trying to get it working with RAD but for some reason I can’t. I can run the program with rad but the debug info doesn’t show up. Literally just trying to debug hello world.
if you’re wondering why debug info with the custom backends doesn’t work; it’s 2 things, it uses DWARF 5 format which majority of debuggers have yet to update to.
It also has zig specific extensions to make debug info for incremental builds much easier to manage.
Even with dwarf 5, zig isn’t officially supported, though it is in the draft for dwarf 6. So debuggers won’t necessarily support zig.
Only the zig lldb fork supports zig afaik, there are some wip debuggers in zig that will likely support zig’s extensions but i dont think any of them currently do.
The reason debug info works with llvm is cause zig uses c++ debug info, which is less than accurate but works well enough for simple debugging.
Sorry for the new year rezz, but I think as a beginner to Zig, having to resort to print/log debugging is going to prove detrimental to my hobby project. I am considering switching to a more mature language with better debugging tools just so that I can make things work (I picked Zig purely to learn it while building a project originally written in C).
Of course, I must appreciate Zig is still pre-release, so it’s quite simply not a mature framework if I get into the weeds. However, even the community still thinks debugging is a non-trivial issue – this is feeling less palatable when I’m not getting any answers while I’m stuck trying to figure out why something panics in my code.
I must consider investing time in learning how to use the packaged LLDB. I’m on Windows and using CLion with the Zigbrains plugin.
You don’t have to resort to print debugging though, you can just force the use of LLVM -fllvm(cli) or .use_llvm = true(build system, in module options), that will do the pretending to be c++ thing which debuggers support well.
zig comes with a pretty printer script (optional) that will print with zig syntax, but running expressions will still use c/c++ syntax.
When using llvm any debugger that supports c/c++ should work without much effort.
Alternatively you can use the lldb fork which properly supports zig as a language, but it requires building it from source, which is not hard just slow.
I have to admit, I don’t know if the situation on Windows has more complications.
Yes, well, I’m trying out VS Code with CodeLLDB, and I hope to return to JetBrains at least. I am feeling slightly nauseated as I speak because I’ve added that .use_llvm and even .use_lld all over my build conf file.
I think it’s most likely a clion/zigbrains issue, but it could also be a specific issue on Windows.
I don’t use either so I can’t help with that. I have used codelldb with zig without much issue, though getting it to use the fork was annoying. But I don’t use that now either, my preferred editor has shitty debugger support atm, so I just use them on the terminal and have had no issues.